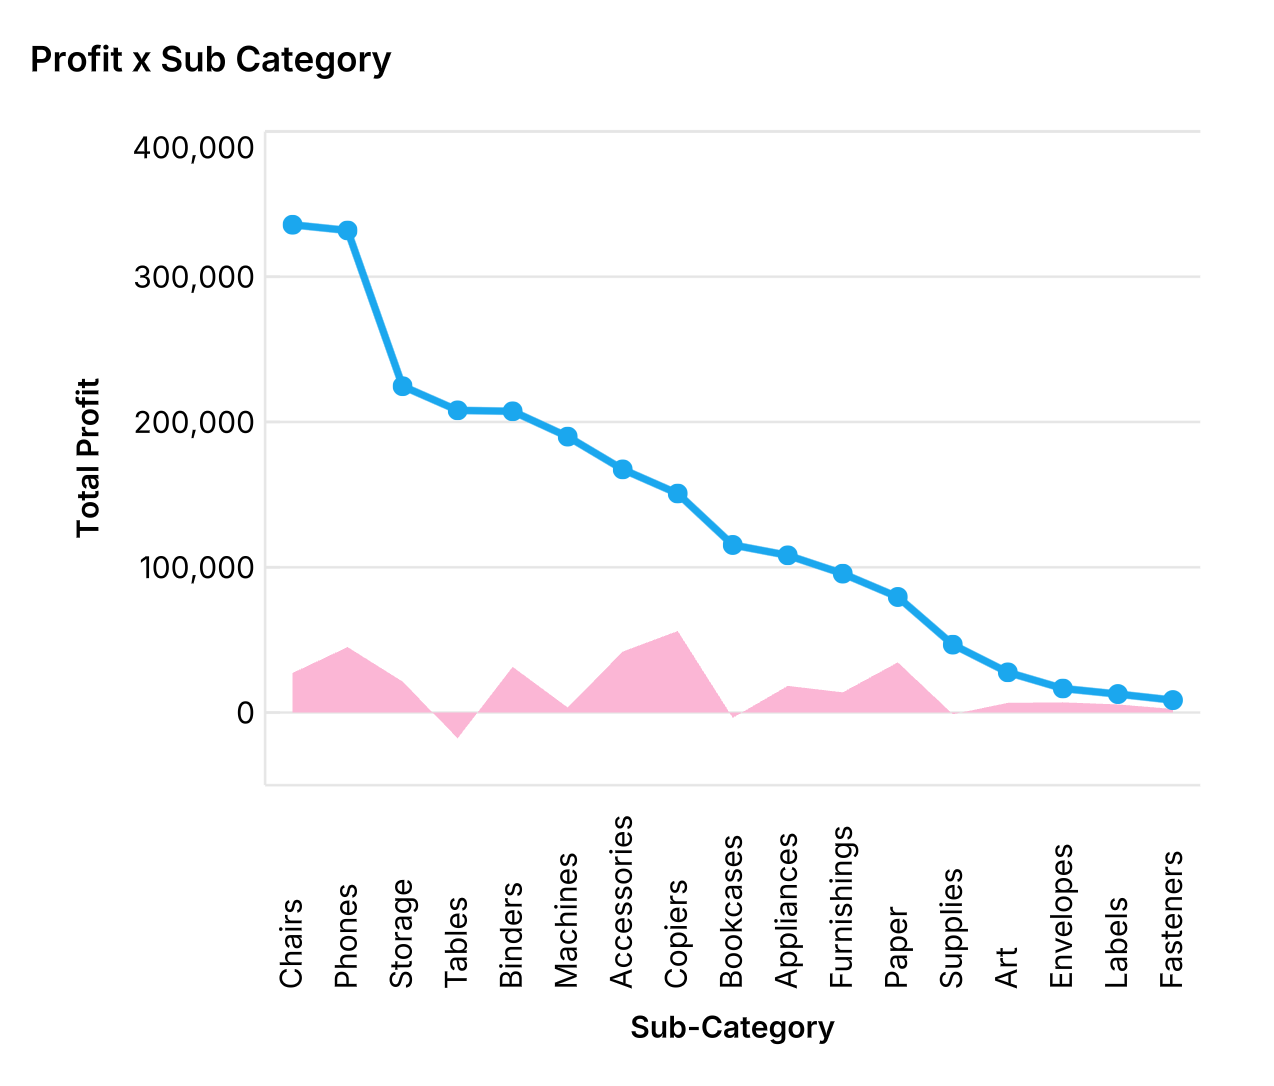
🚀 Announcing the Count Agent. Learn more or join us for a live demo, 22 Jan. ✨
Pricing
Sign InGet Started

Visualizing Data

  • Getting started with visuals
  • Advanced visualizations
  • Every Visual Under the Sun
  • Make your data look great

Reference

  • Visualization overview
  • Templated visuals
  • Custom visuals
  • Formatting a visual
    • Axes
    • Secondary axis
    • Label
    • Legends
    • Title
    • Style
    • Tooltips
    • Layout and sizing
  • Column summaries
  • Dynamic text
  • Filter data in a visual
  • Logic options
  • Display options
  • Color, size and opacity
  • Table
  • Visualization guide
  1. Learn >
  2. Visualizing Data >
  3. Formatting a visual >
  4. Title

Title

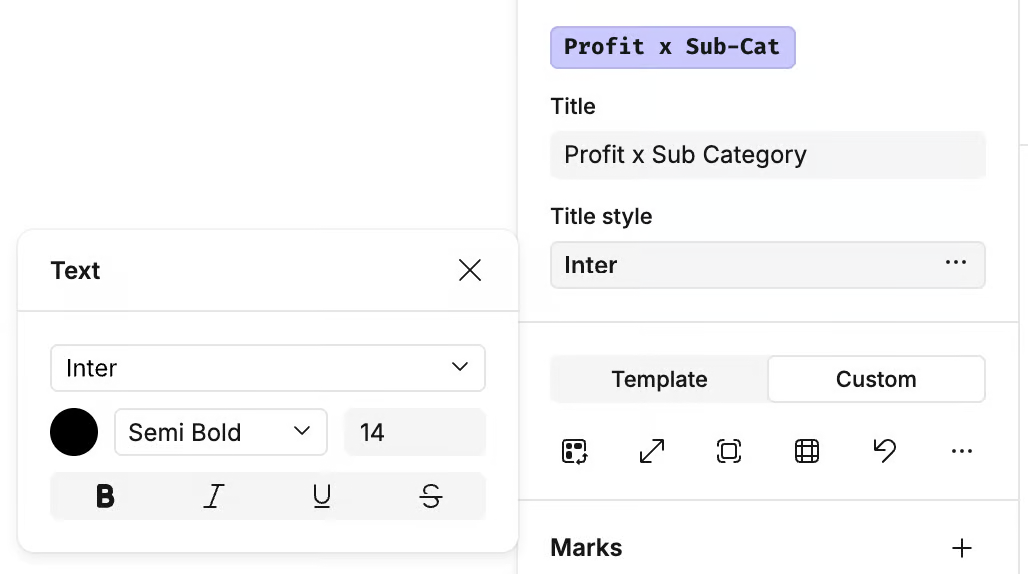
You can add a title to a visualization from the top of the design panel.

Open the ellipses (...) menu in the Title style section to adjust:

  • Font
  • Color
  • Style (e.g., bold, italic)
  • Size

The title is displayed in the top-left corner of the visual cell.

Loading...
Next: Style →
Last updated: 03/12/25
Sound good?

Count is the best way to explore data and solve problems for teams and organizations.

Get started for free
© 2025 Count Technologies Ltd. All rights reserved.
Privacy PolicyTerms of UseCookies PolicyConsent preferences