Templated visuals
Once you've created a visual cell, templated visuals are the quickest way to start constructing a visual and exploring your data.
Create a templated visual
• Create a visual cell — see here for all ways to create a visual cell.
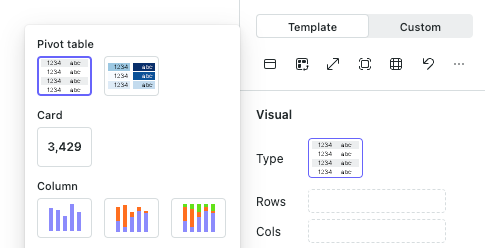
• Select a template — choose a template by clicking the template preview image next to Type. Available categories are: Pivot table, Card, Column, Bar, Line, Area, Scatter, Hierarchy, Flow and Statistics.
• Select the data source - Pick the source you want to build your visual from the dropdown in the design panel on the right. This can be:
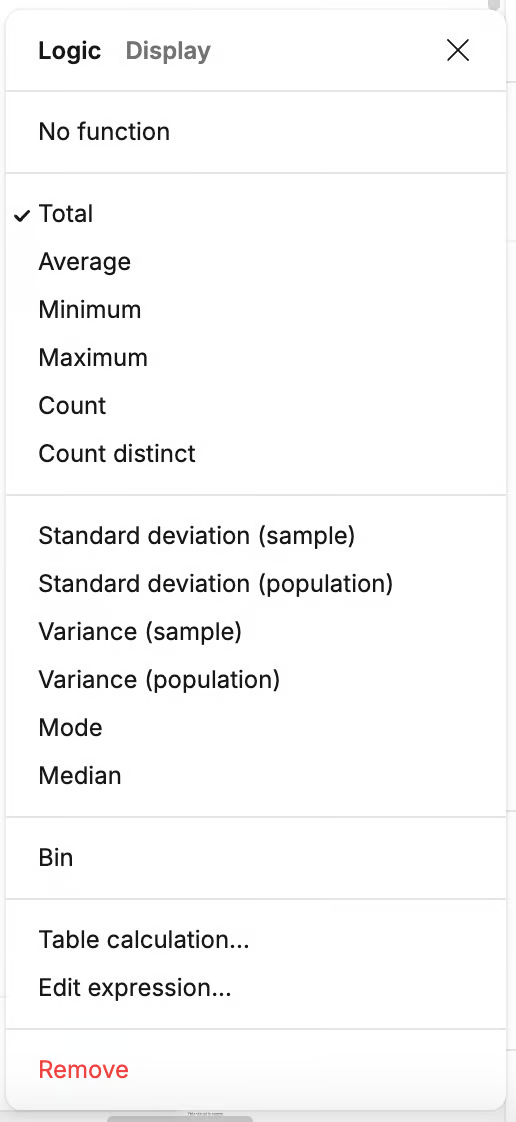
• Choose columns - Drag columns from the sidebar into the available slots for your chosen template.Once placed, you can configure each column using the ellipses (...) menu:
• Filter the data — read more about how to filter the data displayed in your visual here.
• Format the visual — read more about formatting visuals here.
Info
Tip: Clicking on an axis of your visual will sort the data by that value