Map
Maps plot data as point, geoshape, or text on geographic maps. Count uses OpenStreetMap for map base layer.
Template options
- Point-data
- Regional/geoshapes
Mapping (get it) options
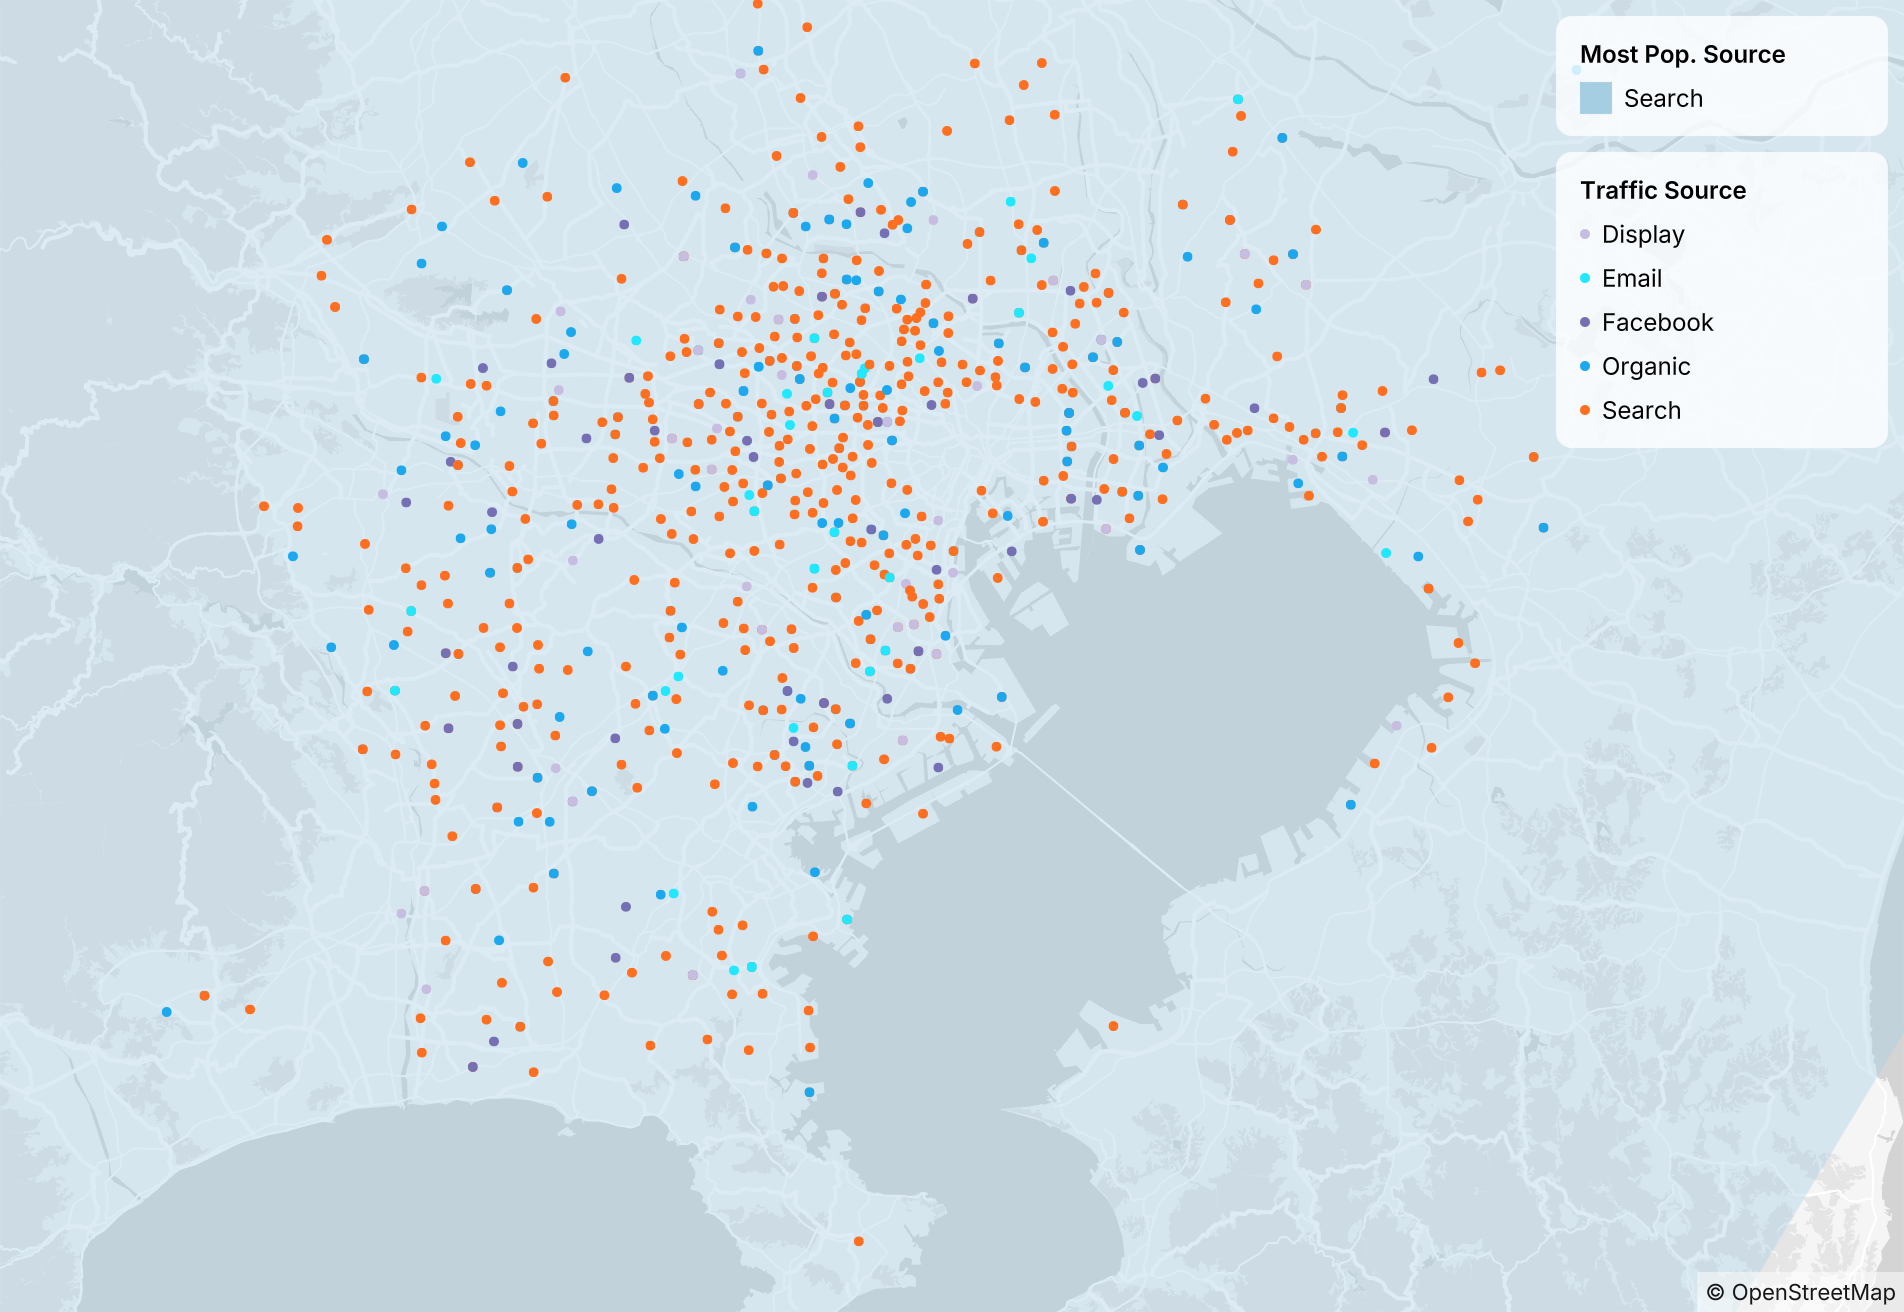
When using the point template
• Longitude → The numeric measure for east–west (e.g. 136.90190270)
• Latitude → The numeric measure for north–south (e.g. 34.992687270)
• Size → Measure for point size.
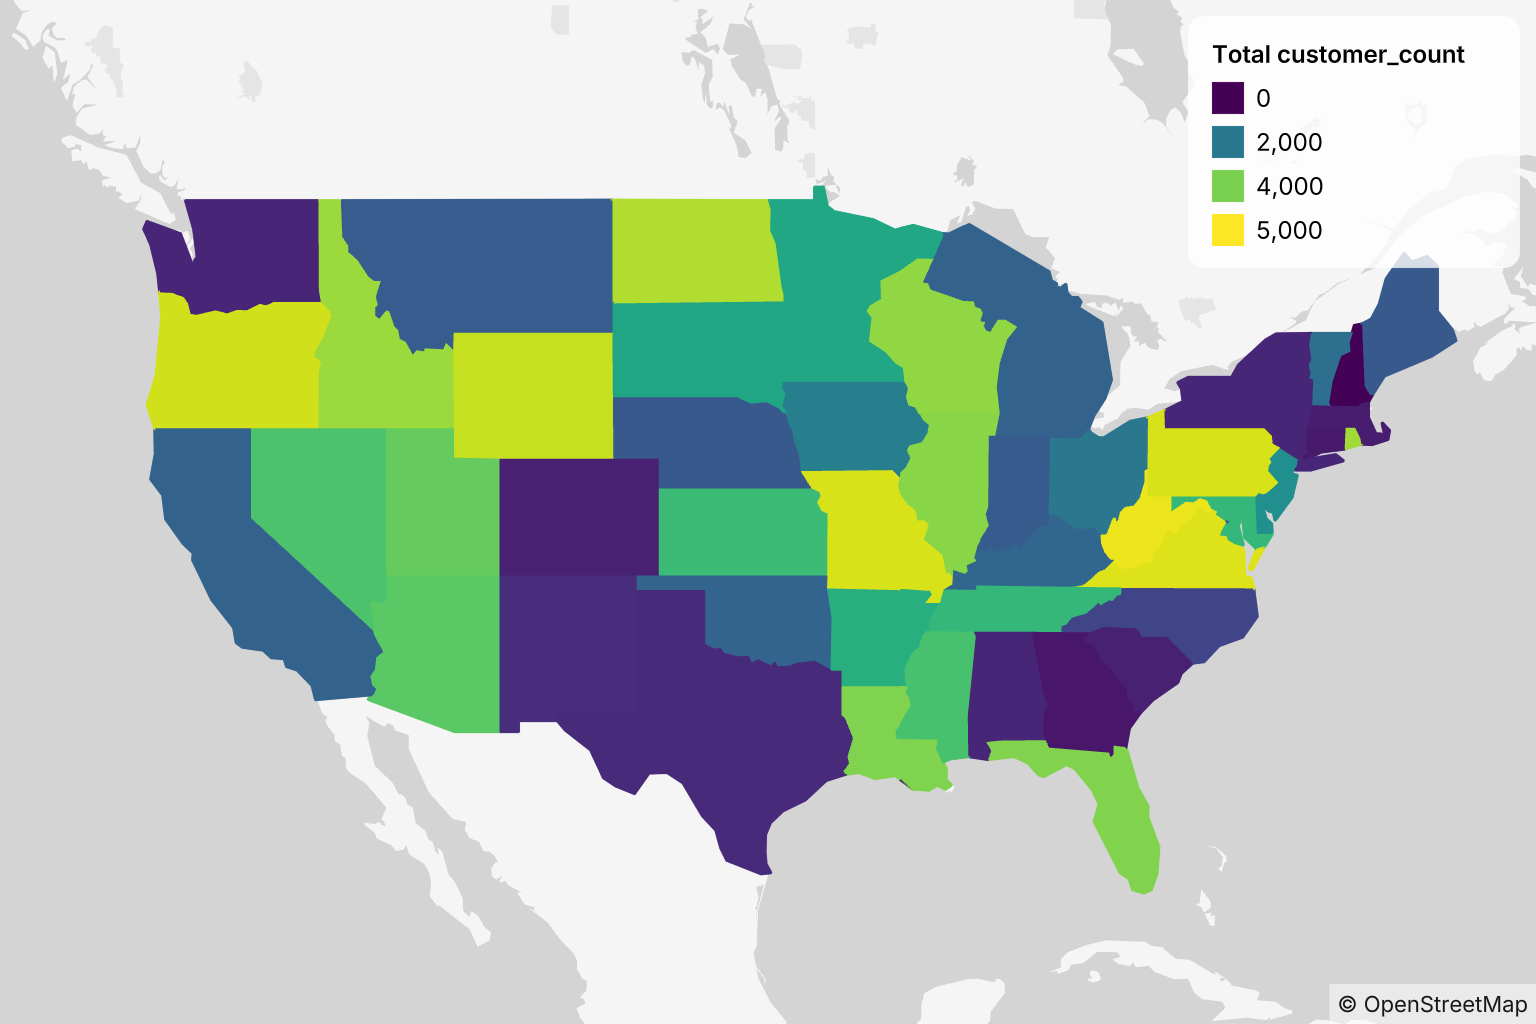
When using the geoshape template
• Region → GeoJSON or WKT definition of the region.
• Color → Dimension to split points/region by series.
• Opacity → Dimension to split points/region by series.
• Detail → On-hover tooltip content
You can see some sample data and Map visualisation in this canvas