Make your data look great
Count gives you incredible creative freedom to visualize and layout your data exactly how you want it. But let's be honest - we all want to sprint from "analysis complete" to "wow, that looks amazing" as quickly as possible.
Tutorial summary
Understand the features and best practices that'll help you style your data outputs beautifully and efficiently, so you can spend less time fiddling with formatting and more time making an impact.
What you will learn
- Templates for fast, professional output
- Shared colors for consistent company branding across all elements
- Copy/paste styles to quickly format multiple objects
- Shapes to organize and add visual depth
- Alignment tools for polished, professional layouts
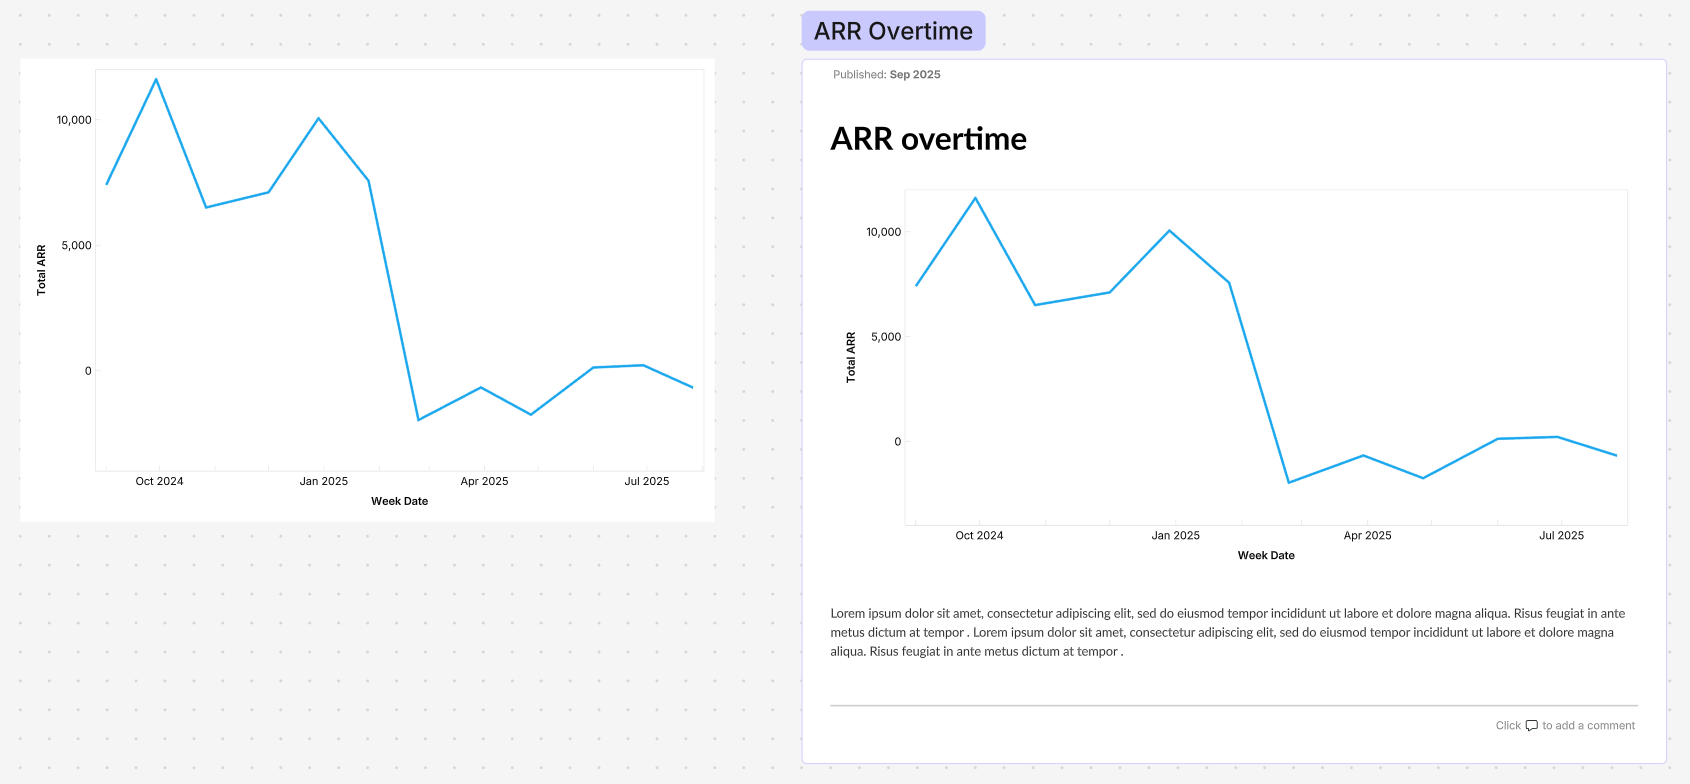
Templates
Templates help to standardize your output whilst maintaining high-quality design.
- Drag and drop your visual onto a template to instantly apply pre-designed styling.
- Use this for a multitude of formats, including cards and layouts (including dashboards), and add your company branding for a personalised look.
- Use Report view to directly share your template, helping you deliver quality with speed.
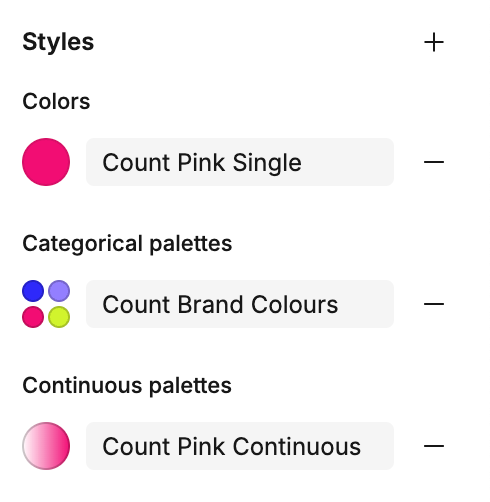
Shared colours
Create a set of brand colours to access instantly across your canvas or workspace.
- Create shared styles - go to Design -> Styles -> Press '+' to create named palettes for single, categorical, or continuous colors.
- Access everywhere - find your shared styles in 'Shared' colors and use across all visuals, tables, and text.
- Update instantly - changes to styles automatically update all references.
- Share with team - Enterprise/Scale customers can share workspace-wide; others can save as templates.styles will instantly update all references to that style.
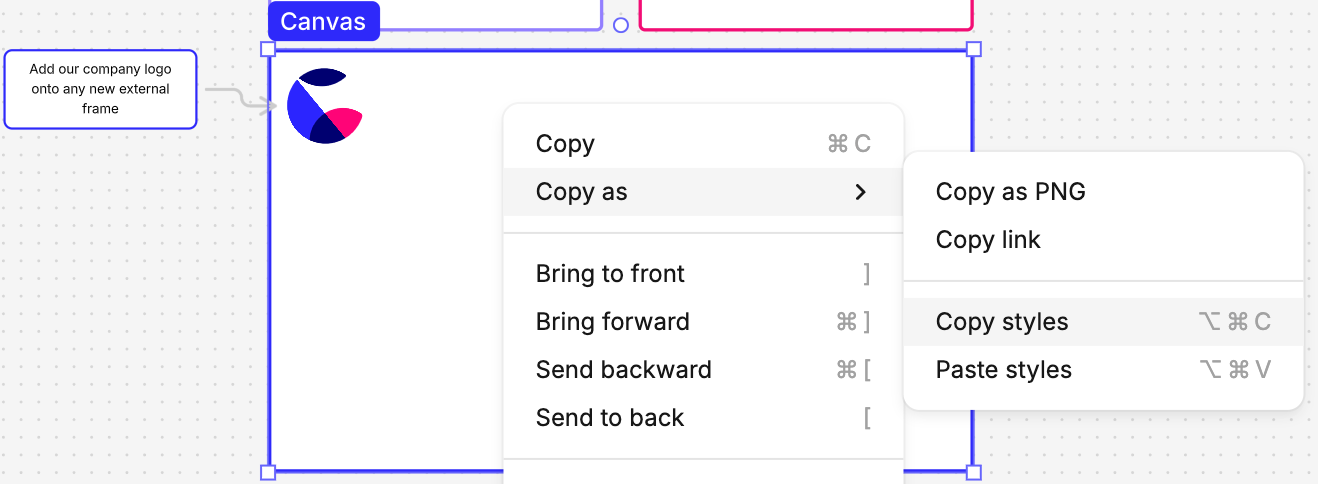
Copy & paste styles
Use this feature to paste your styles across visuals, tables and text.
- Right-click -> Copy as -> Copy styles -> and then Paste styles on your target object.
- For charts, this will copy all formatting (colors, font, font size) for complete consistency.
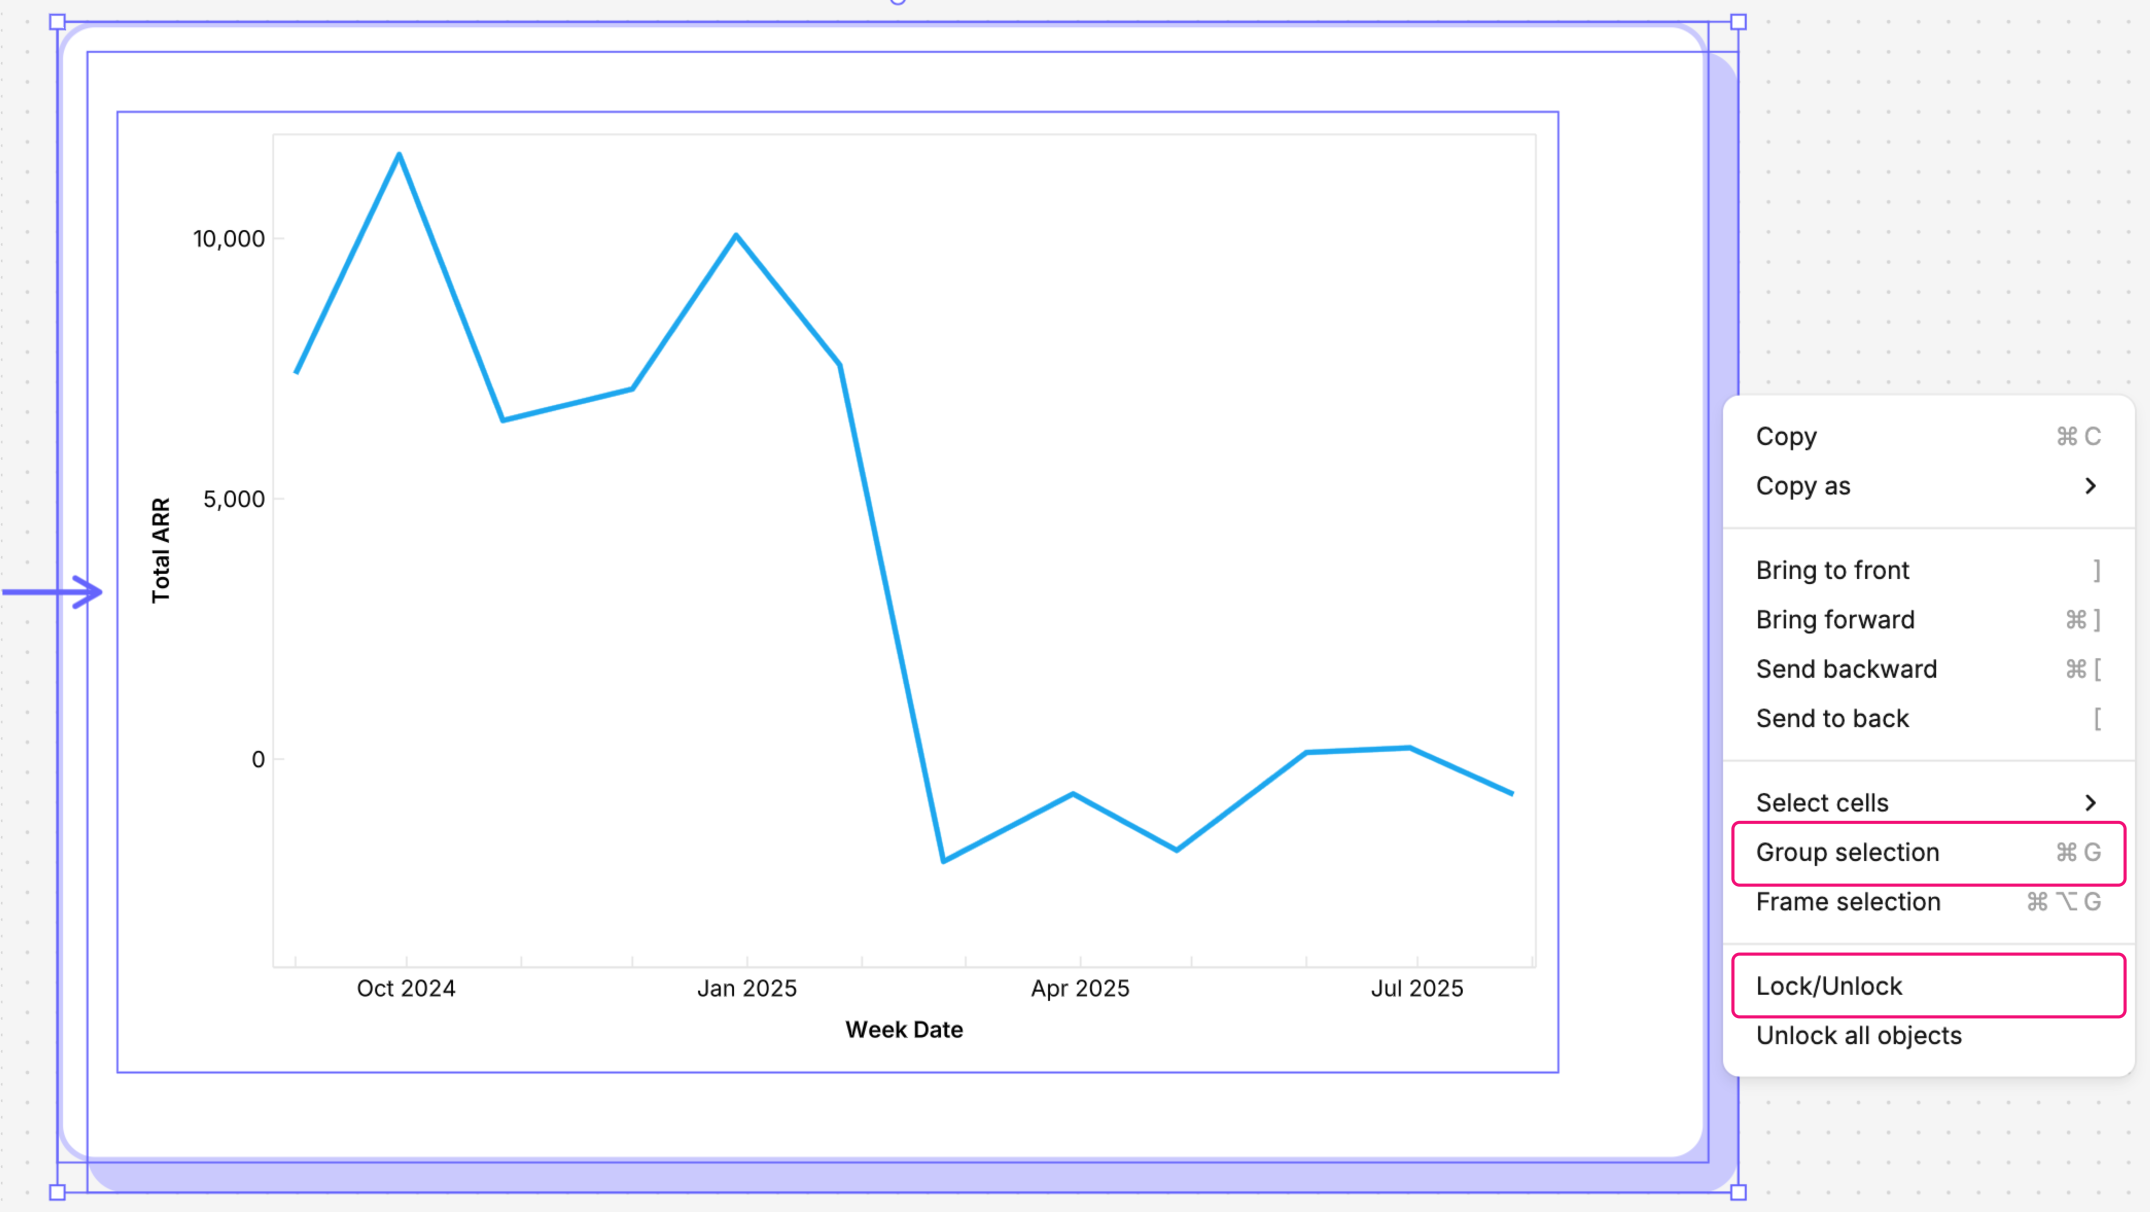
Shapes
Use shapes for data organization.
- Frame objects with shapes, add depth and apply styles for a professional finish.
- Group objects for flexibility to move them together seamlessly.
- Lock objects to secure them in one place, preventing accidental movements.
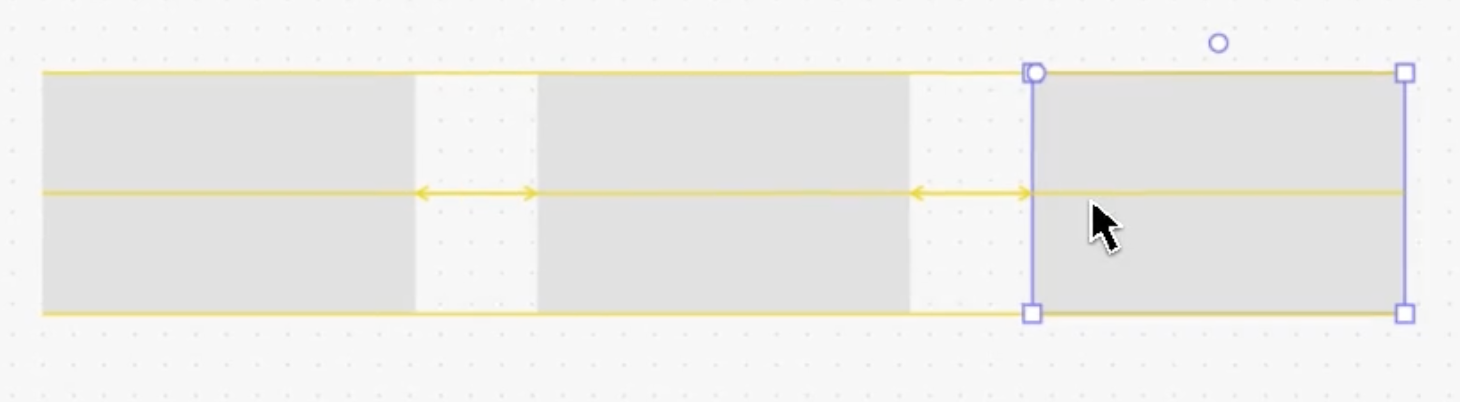
Aligning objects
Aligning objects will help your canvas look more professional and reduce clutter.
- Enable smart guides by File -> Preferences -> Snap to object/grid for automatic alignment and spacing assistance.
- Manually adjust spacing by selecting objects, then use Design panel to align (left/center/right/vertical) and distribute spacing.
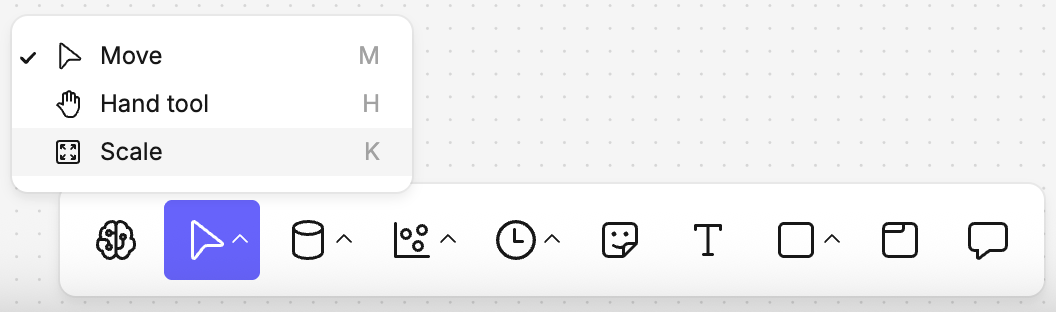
Scaling elements
The infinite space to make use of on canvases can often mean elements are built at different scales on one or between canvases.
The scale tool helps align the scale of different elements, making building and sharing canvas elements simple.