Column summaries
Create a column summary chart
Drag any column from a cell, table, or CSV cell from the data side bar into the canvas to generate an automatic visual summary of that column.

Summary types
Depending on the data type of your column, different column summaries are created:
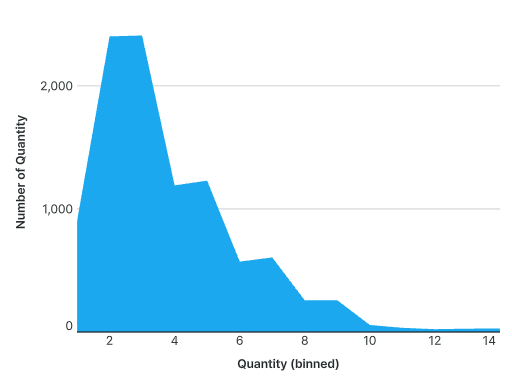
- Numerical columns - binned histograms
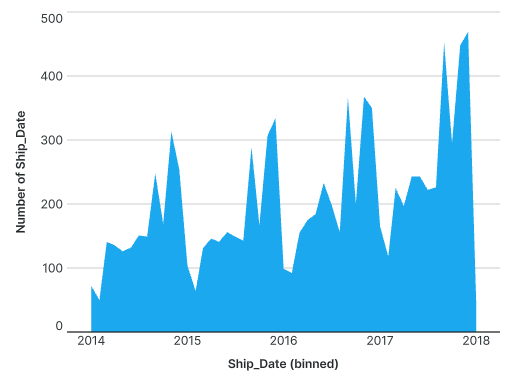
- Datetime columns - time series
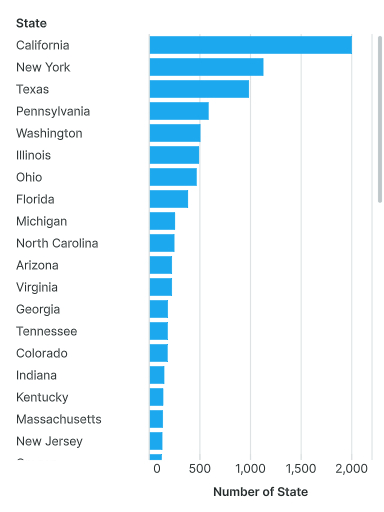
- All other column types - horizontal bar charts