Legends
A legend acts as a key that explains the symbols, colors, or patterns in your chart (similar to a map key) helping readers understand what each element represents.
Legends can be customized in the following ways:
- Hide/show the legend
- Hide/show specific fields and marks in the legend
- Change the title of the legend, and the display name of each mark
- Change the position of the legend
- Change the font style of the legend title and display names
Hide/show the legend
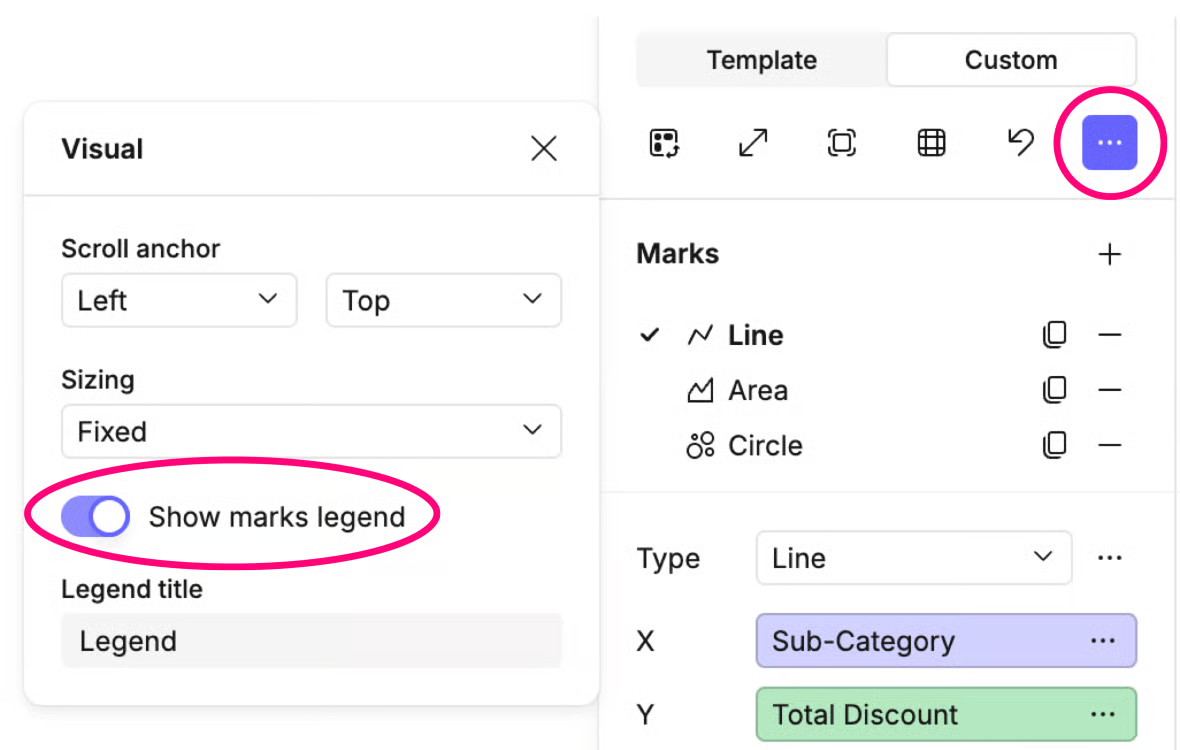
- To hide or show the legend click the ellipses (...) for the visual (which is just below the Custom tab) and toggle to show or hide it.
- When toggled on, you can also change the title of your legend.
It is also possible to hide a legend by right-clicking directly on a legend title in the canvas and selecting Hide legend
Hide/show specific fields and marks in the legend
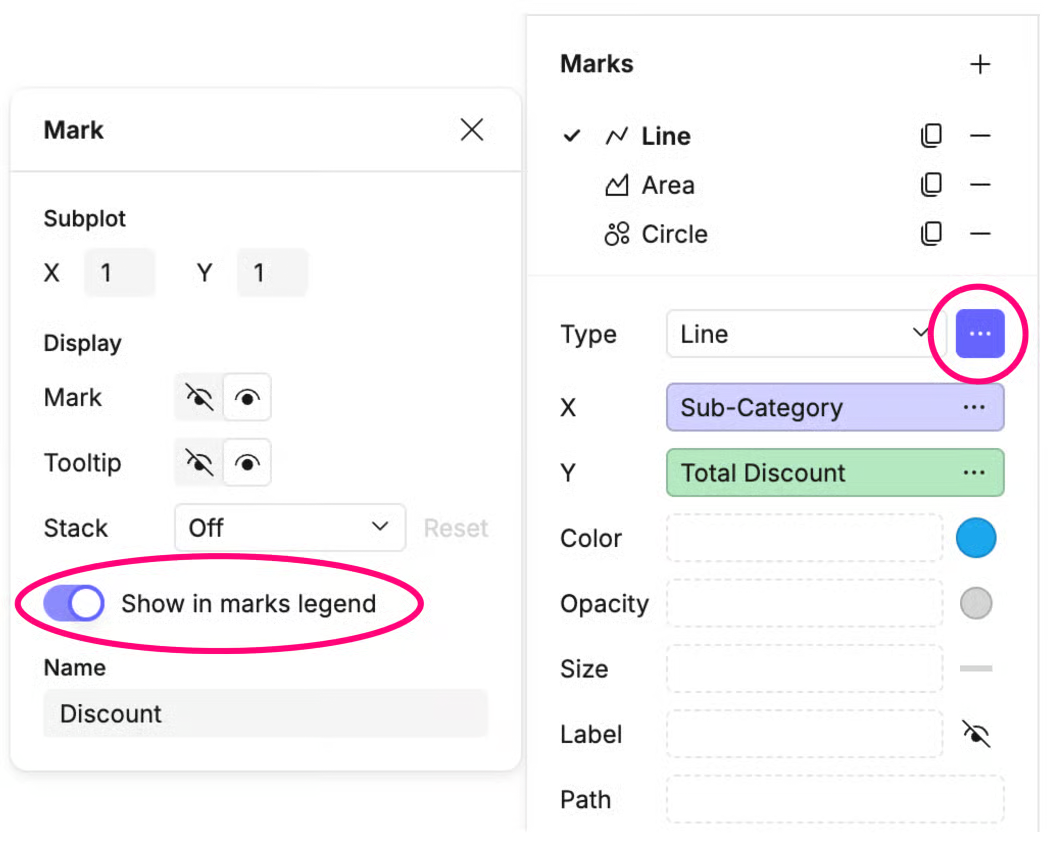
To show/hide specific marks in the legend:
- Select the ellipses (...)menu next to the mark type.
- Toggle on or off Show marks in legend
- Edit the display name for the mark in the legend if required
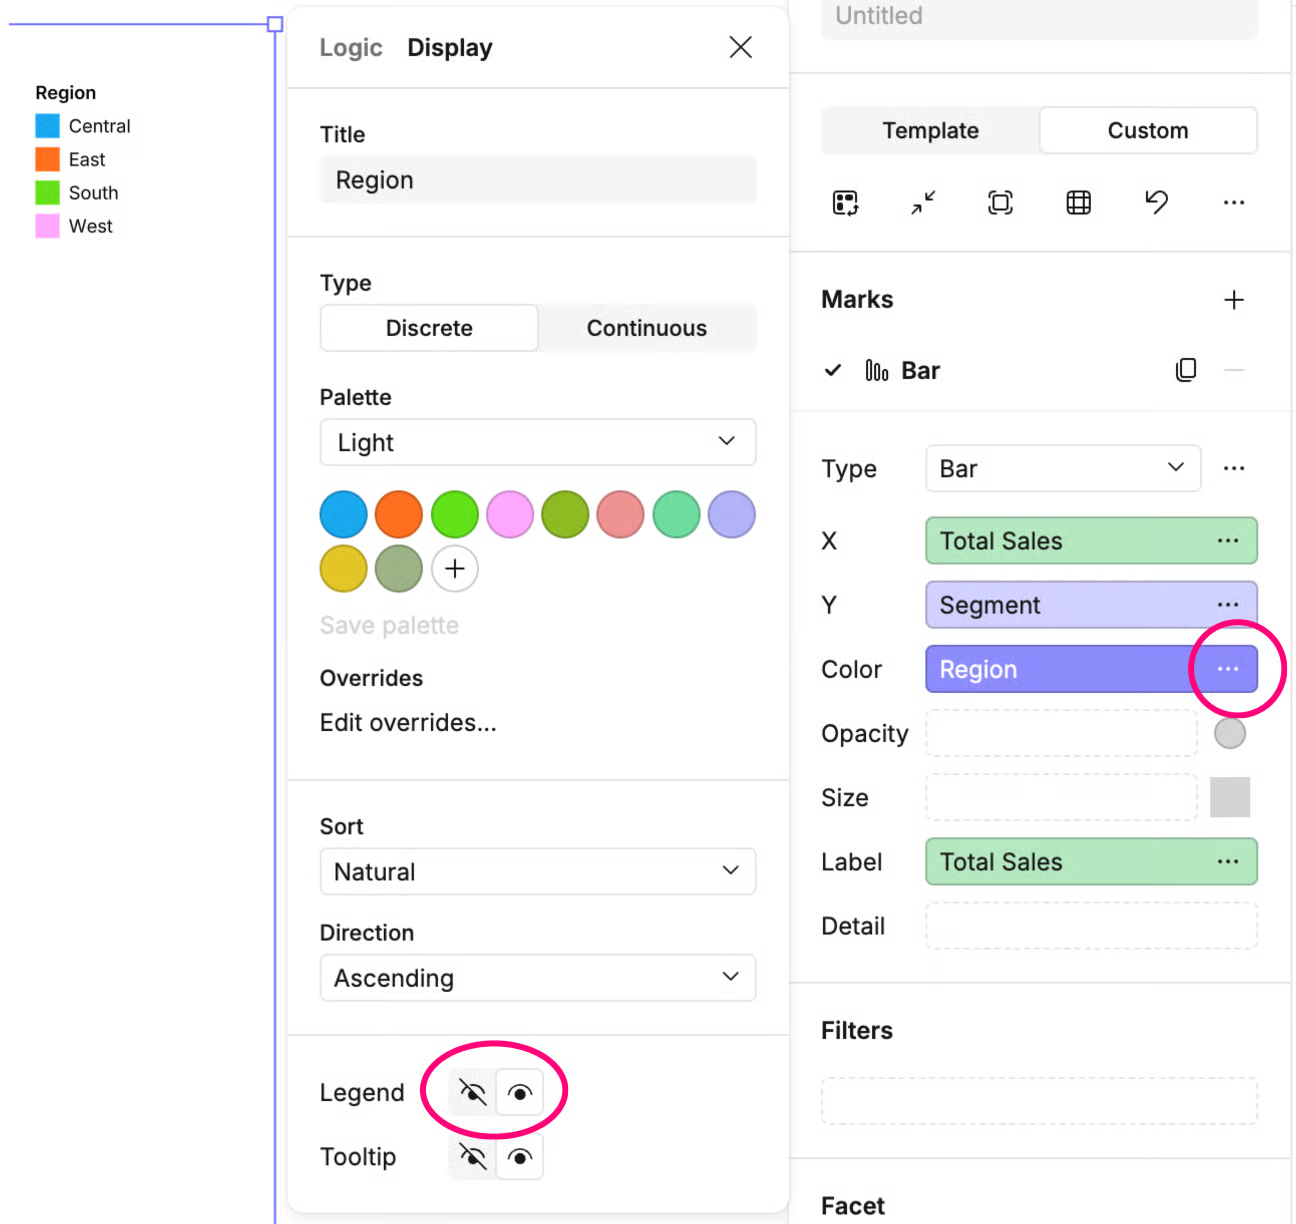
To show/hide specific fields in the legend:
- Navigate to the field you want to unhide the legend for.
- Click the ellipses (...)menu.
- Go to Display and enable the legend.
You can also access the above options by right-clicking on a category in the legend itself and selecting Edit legend...
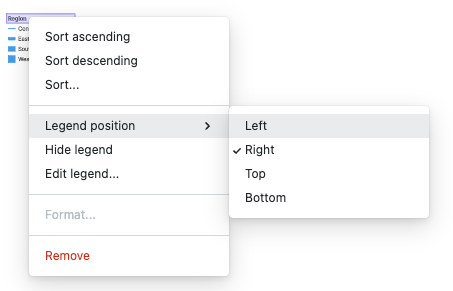
Setting legend position
- Right-click on the legend title.
- Select a position from the Legend position menu.
Font style of legends
Refer to the Style section for formatting the font style within legends.