Flow Chart
Flow charts show how values move through stages or categories.
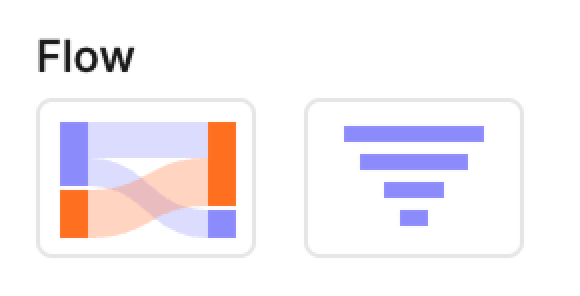
• Sankey displays flows between multiple levels.
• Funnel shows sequential drop-offs through a process.
Sankey chart
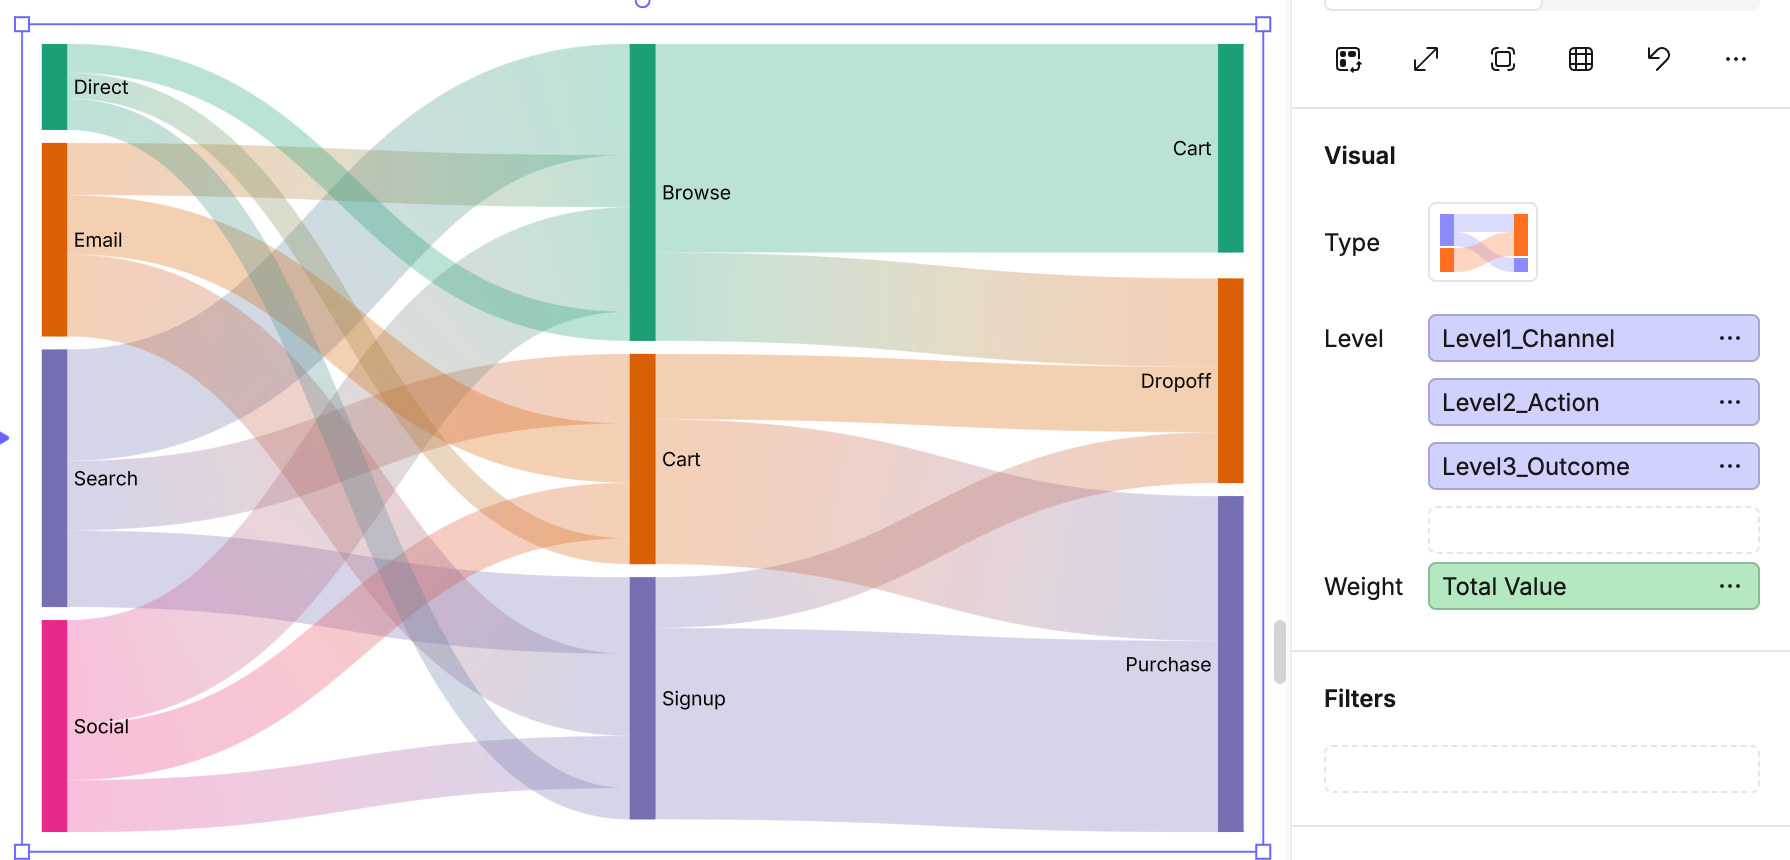
A Sankey chart shows how values flow across multiple levels, with line thickness representing size.
Data shape - your data must be in wide format: one column per level, plus a numeric column for the flow size. Each row describes one path through the levels.
| Level1\_Channel | Level2\_Action | Level3\_Outcome | Value |
| --------------- | -------------- | --------------- | ----- |
| Search          | Browse         | Cart            | 1200  |
| Search          | Signup         | Purchase        | 900   |
| Social          | Cart           | Dropoff         | 350   |
Mapping options
• Level → Add each level column in order (e.g. Level1Channel, Level2Action, Level3Outcome).
• Weight → Numeric column for flow size (e.g. Value).
Tips
• At least two Level columns are required; more levels extend the flow.
• If your data has levels stacked in a single column (long format), reshape it so each stage gets its own column.
Funnel chart
A Funnel chart shows how values drop off across sequential stages.
Data shape - your data should be in long format: one column for the stage name and one column for the measure.
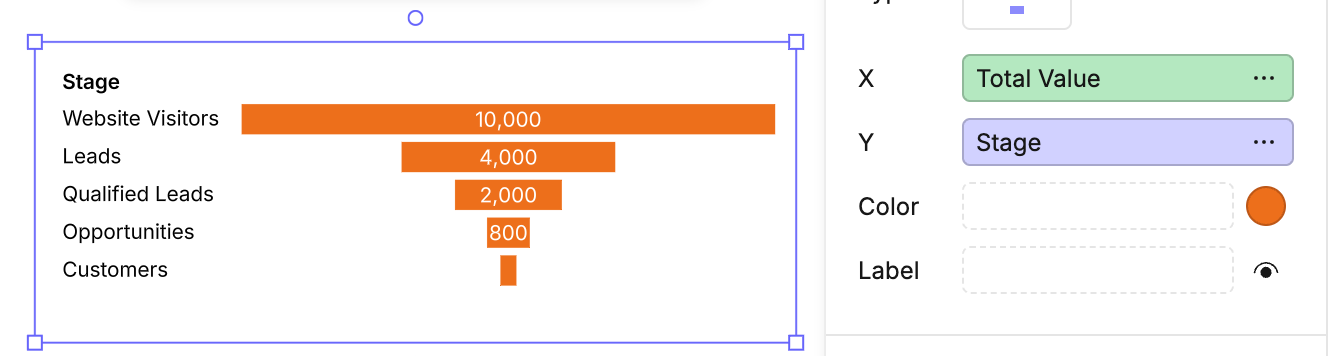
Mapping options
• X → Measure column for stage size (e.g. Value).
• Y → Dimension column for stage names (e.g. Stage).
• Color → Dimension to split each stage into sub-groups.
• Label → Annotates stages with text.
Tips
• Works best with fewer than 6–7 stages.
• Values should decrease progressively—funnels are less clear if the sequence jumps up and down.
• Adding Color can highlight different groups moving through the same steps.