Table
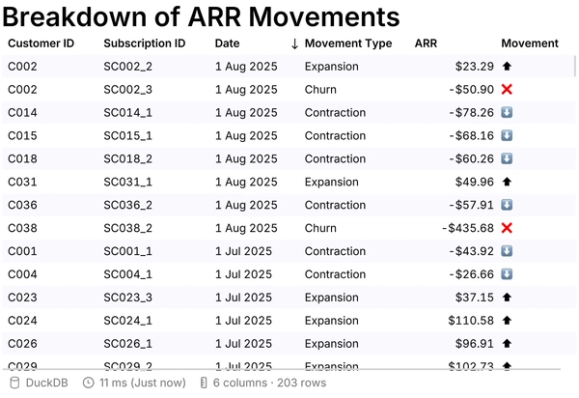
Tables excel at presenting precise data with clear row/column comparisons that anyone can interpret instantly.
They're versatile enough to show everything from detailed breakdowns to high-level summaries, making complex information accessible.
Adding in a table
There are two ways to add in a table:
- Toolbar -> Low-code -> select Table
- Select an existing cell and press '+' (add a cell) -> select Table
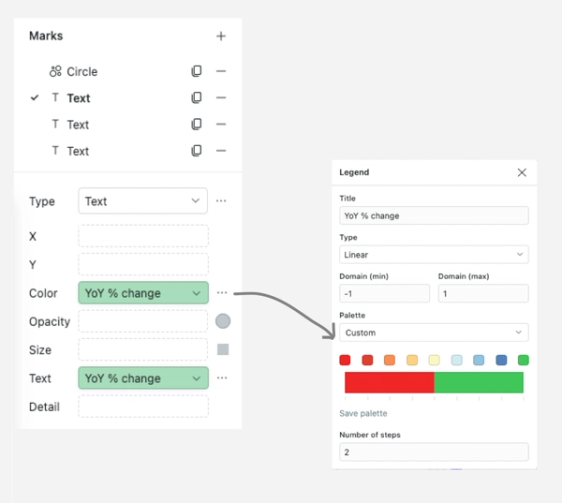
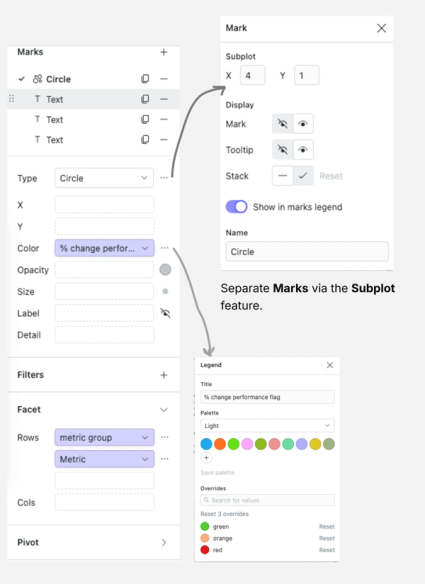
Formatting your table
- Customize easily by adding titles, drag columns into place, apply filters, and style to match your needs.
- Tables display up to 10,000 rows by default, but you can set custom limits or choose unlimited rows.
- Export as SQL, PNG, PDF, or CSV to distribute your data in any format and share seamlessly.

Table versus pivot table
Table Cell:
• Great for quickly visualising your data
• Easy sorting and filtering
• Can work with aggregated data from the SQL cell
• Good for exporting the CSV in the same format
• Great for summarising data
• Easy grouping across rows/columns
• Less flexible around sorting/filtering
• Cannot export pivots in their pivot format