Logic options
When you add a column to a visual, you can configure it in two ways: Logic and Display. These options are available from the ellipses (...) menu next to the column name in the design bar.
- Logic – Controls how the column is calculated or aggregated.
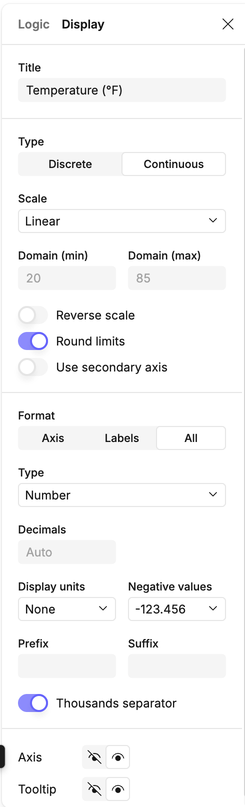
- Display – Controls how the result is formatted and shown in the visual.
Logic tab
The Logic tab lets you choose how to calculate or transform the data in a column before it’s plotted.
Text fields
For categorical or free-text fields, you can only use functions that make sense for non-numeric data:
- No function – Show raw text values.
- Count – Count all rows.
- Count distinct – Count unique text values.
- Minimum / Maximum – Return the first or last value in sort order (e.g. alphabetically).
- Edit expression… – Write a custom expression (see calculations in visuals).
- Remove – Remove the column from the visual.
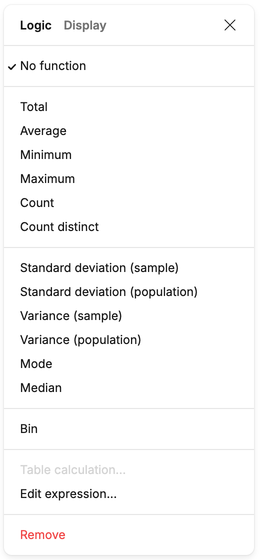
Numeric fields
For numeric values, you’ll see the full set of aggregations:
- No function – Show raw values (only available in some visual types).
- Total / Sum – Aggregate values by summing.
- Average – Mean of the values.
- Minimum / Maximum – Lowest or highest value.
- Count – Count of rows.
- Count distinct – Count of unique values.
- Mode, Median – Most common or middle value.
- Standard deviation (sample / population) – Spread of the values.
- Variance (sample / population) – Variability of the values.
- Bin – Bucket values into ranges.
- Table calculation… – Apply a secondary calculation across the table (see Table calculations).
- Edit expression… – Write a custom expression (see calculations in visuals).
- Remove – Remove the column from the visual.
Date fields
For dates and times, you can aggregate by measure or transform into parts of a date:
- No function – Show raw date values.
- Minimum / Maximum – Earliest or latest date.
- Count / Count distinct – Count rows or unique dates.
- Truncate to date part – Year, Quarter, Month, Week, Day.
- Extract repeating part – Month of year, Week of year, Day of year, Day of month, Day of week.
- Table calculation… – Apply a secondary calculation across the table (see Table calculations).
- Edit expression… – Write a custom expression (see calculations in visuals).
- Remove – Remove the column from the visual.