Welcome to Count Metrics
Tutorial summary
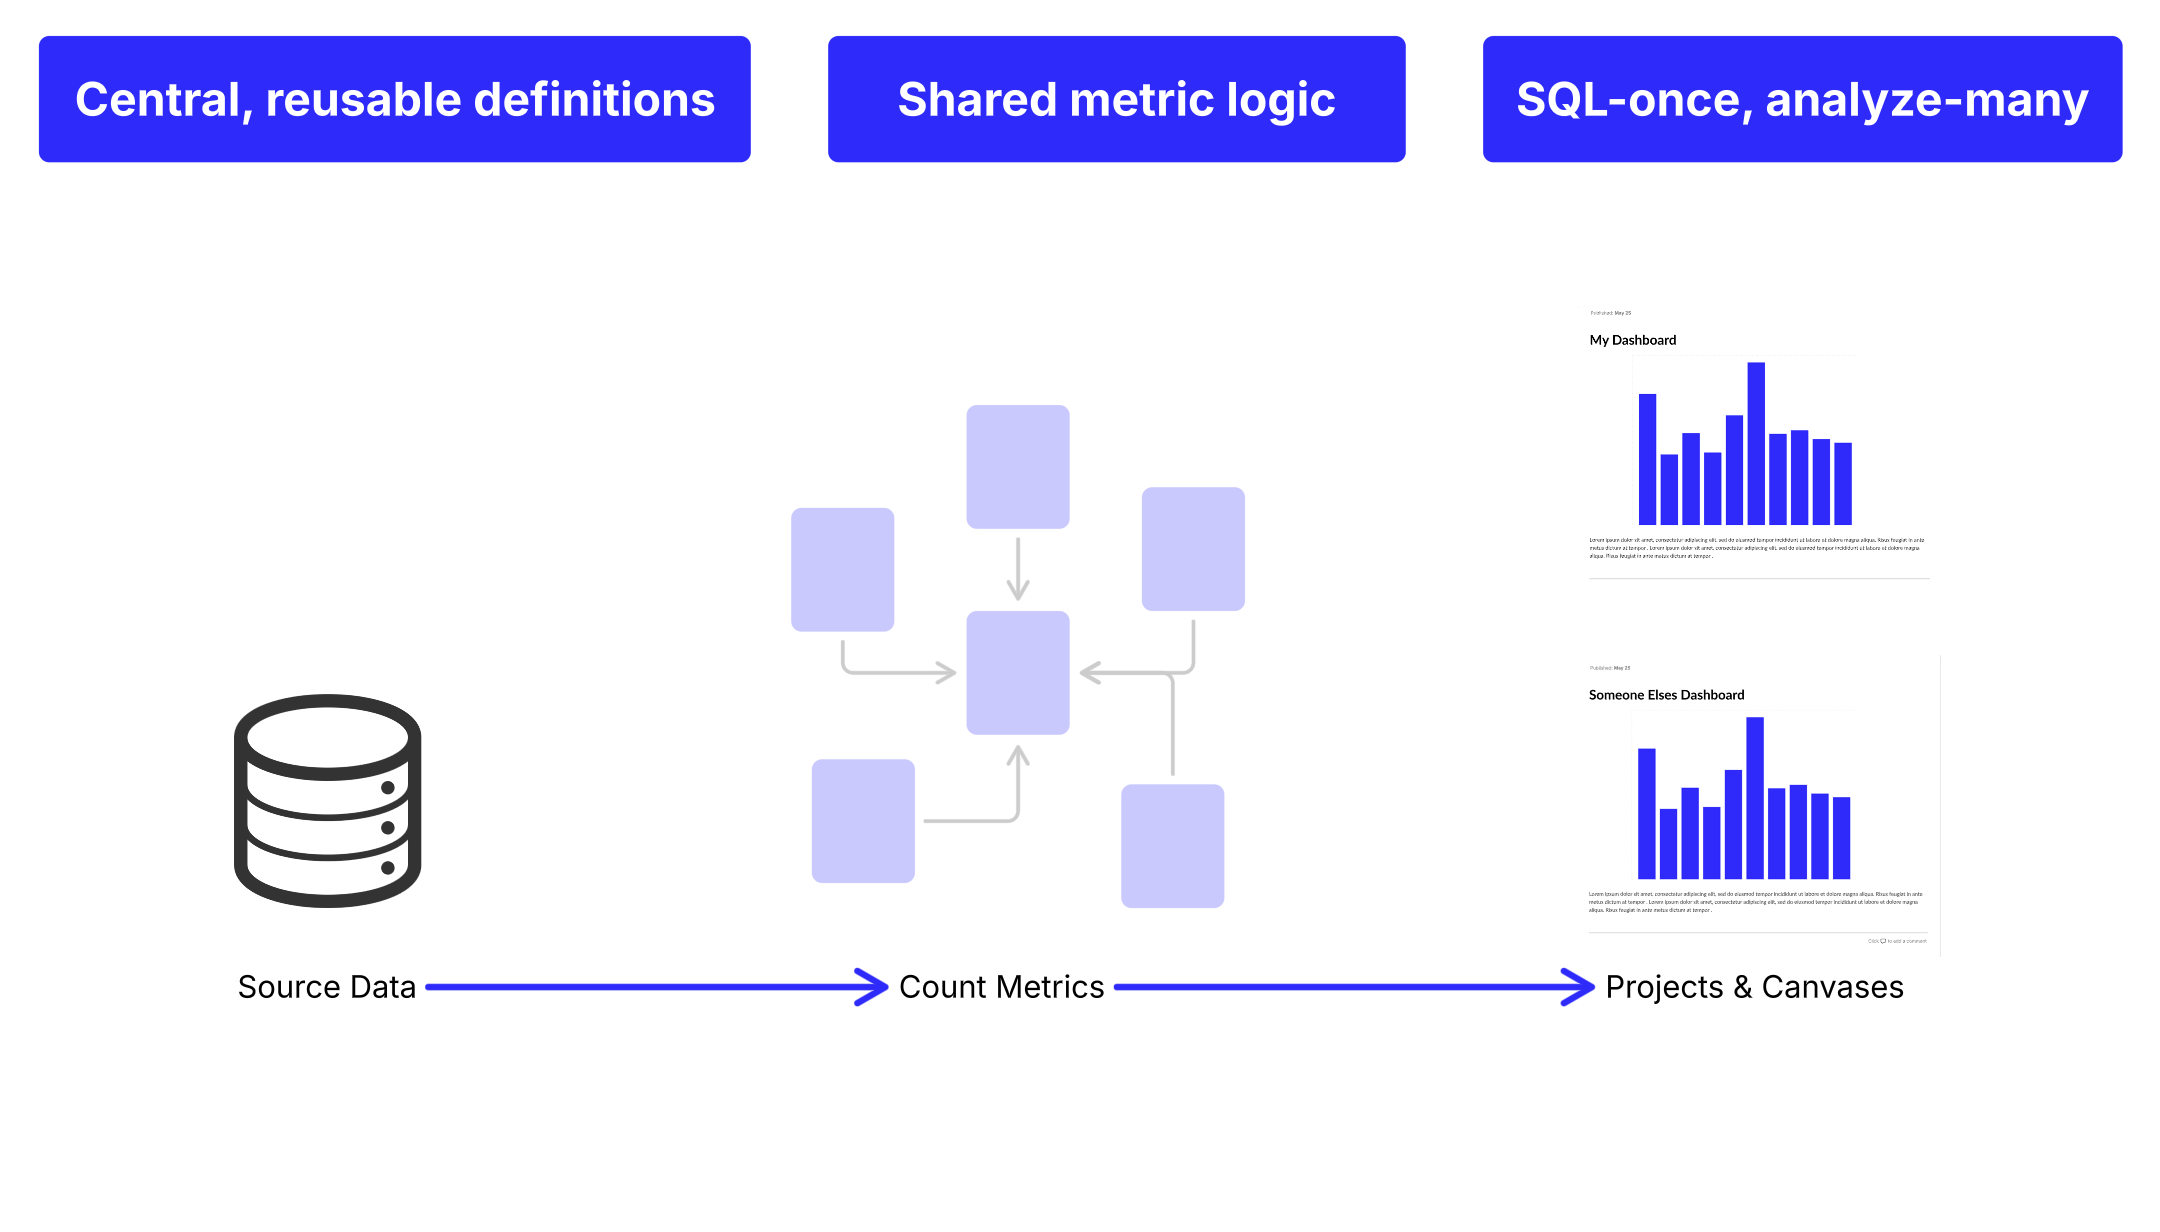
Count Metrics is a tool designed to make data analysis faster and more reliable. It centralizes all your business logic, so you don’t have to keep rewriting queries or worry about inconsistencies.
By creating reusable definitions for key metrics like revenue or retention, it helps teams stay aligned and reduces errors. Dashboards load quicker, insights come faster, and everyone—from beginners to data experts—can explore data without friction.
Manage your metrics like code—track changes, collaborate, and test in branches before deploying. With GitHub integration, sync everything alongside your codebase and experiment without affecting live dashboards.
In short, Count Metrics takes the complexity out of working with data, giving you more time to focus on understanding and acting on your insights.
The Count Metrics advantage
There are 4 key advantages to using a semantic layer:
- consistent metrics
- focus on insights
- less back and forth
- fewer data requests
These all help to bring clarity, speed, and consistency to your analytics workflow. Here’s how Count Metrics transforms the way your team works with data:
• Democratized complex SQL code write complex queries once, reuse everywhere
• Reduced errors and inconsistencies align teams on shared definitions like revenue or retention
• Faster, clearer insights for decision makers Empower your explorer community to produce their own low-code analysis on pre-built Count Metrics datasets
• Less time wrangling and more time analyzing Standardize repetitive SQL logic and free up more time to focus on insights
• Unlimited exploration without burdening source systems via customizable caching analysts can explore data cached on our server without overloading your connected database
• Lower canvas load times via customizable caching, canvas load times are significantly reduced
Designed for deep integration with the canvas, Count Metrics makes it easy for both technical and non-technical users to explore data and use metrics exactly where they are needed.
What this doesn't mean
| Myth | Reality |
|---|---|
| ❌ You can’t write SQL anymore | ✅ You still write SQL, you just write the complex, or reusable parts once and reuse them everywhere. |
| ❌ You’ll lose flexibility | ✅ You can still write custom queries when needed. Count Metrics standardizes the boring bits so you can focus on deep analysis. |
| ❌ It’s only for data engineers | ✅ In Count, designing and evolving the semantic layer can be a collaborative activity. Your semantic layer is a shared foundation - not an owned artifact. |
Common use cases
• Creating operational reports from a set of company defined metrics
• Allowing stakeholders to self serve
• Simplified reporting
• Quick data exploration
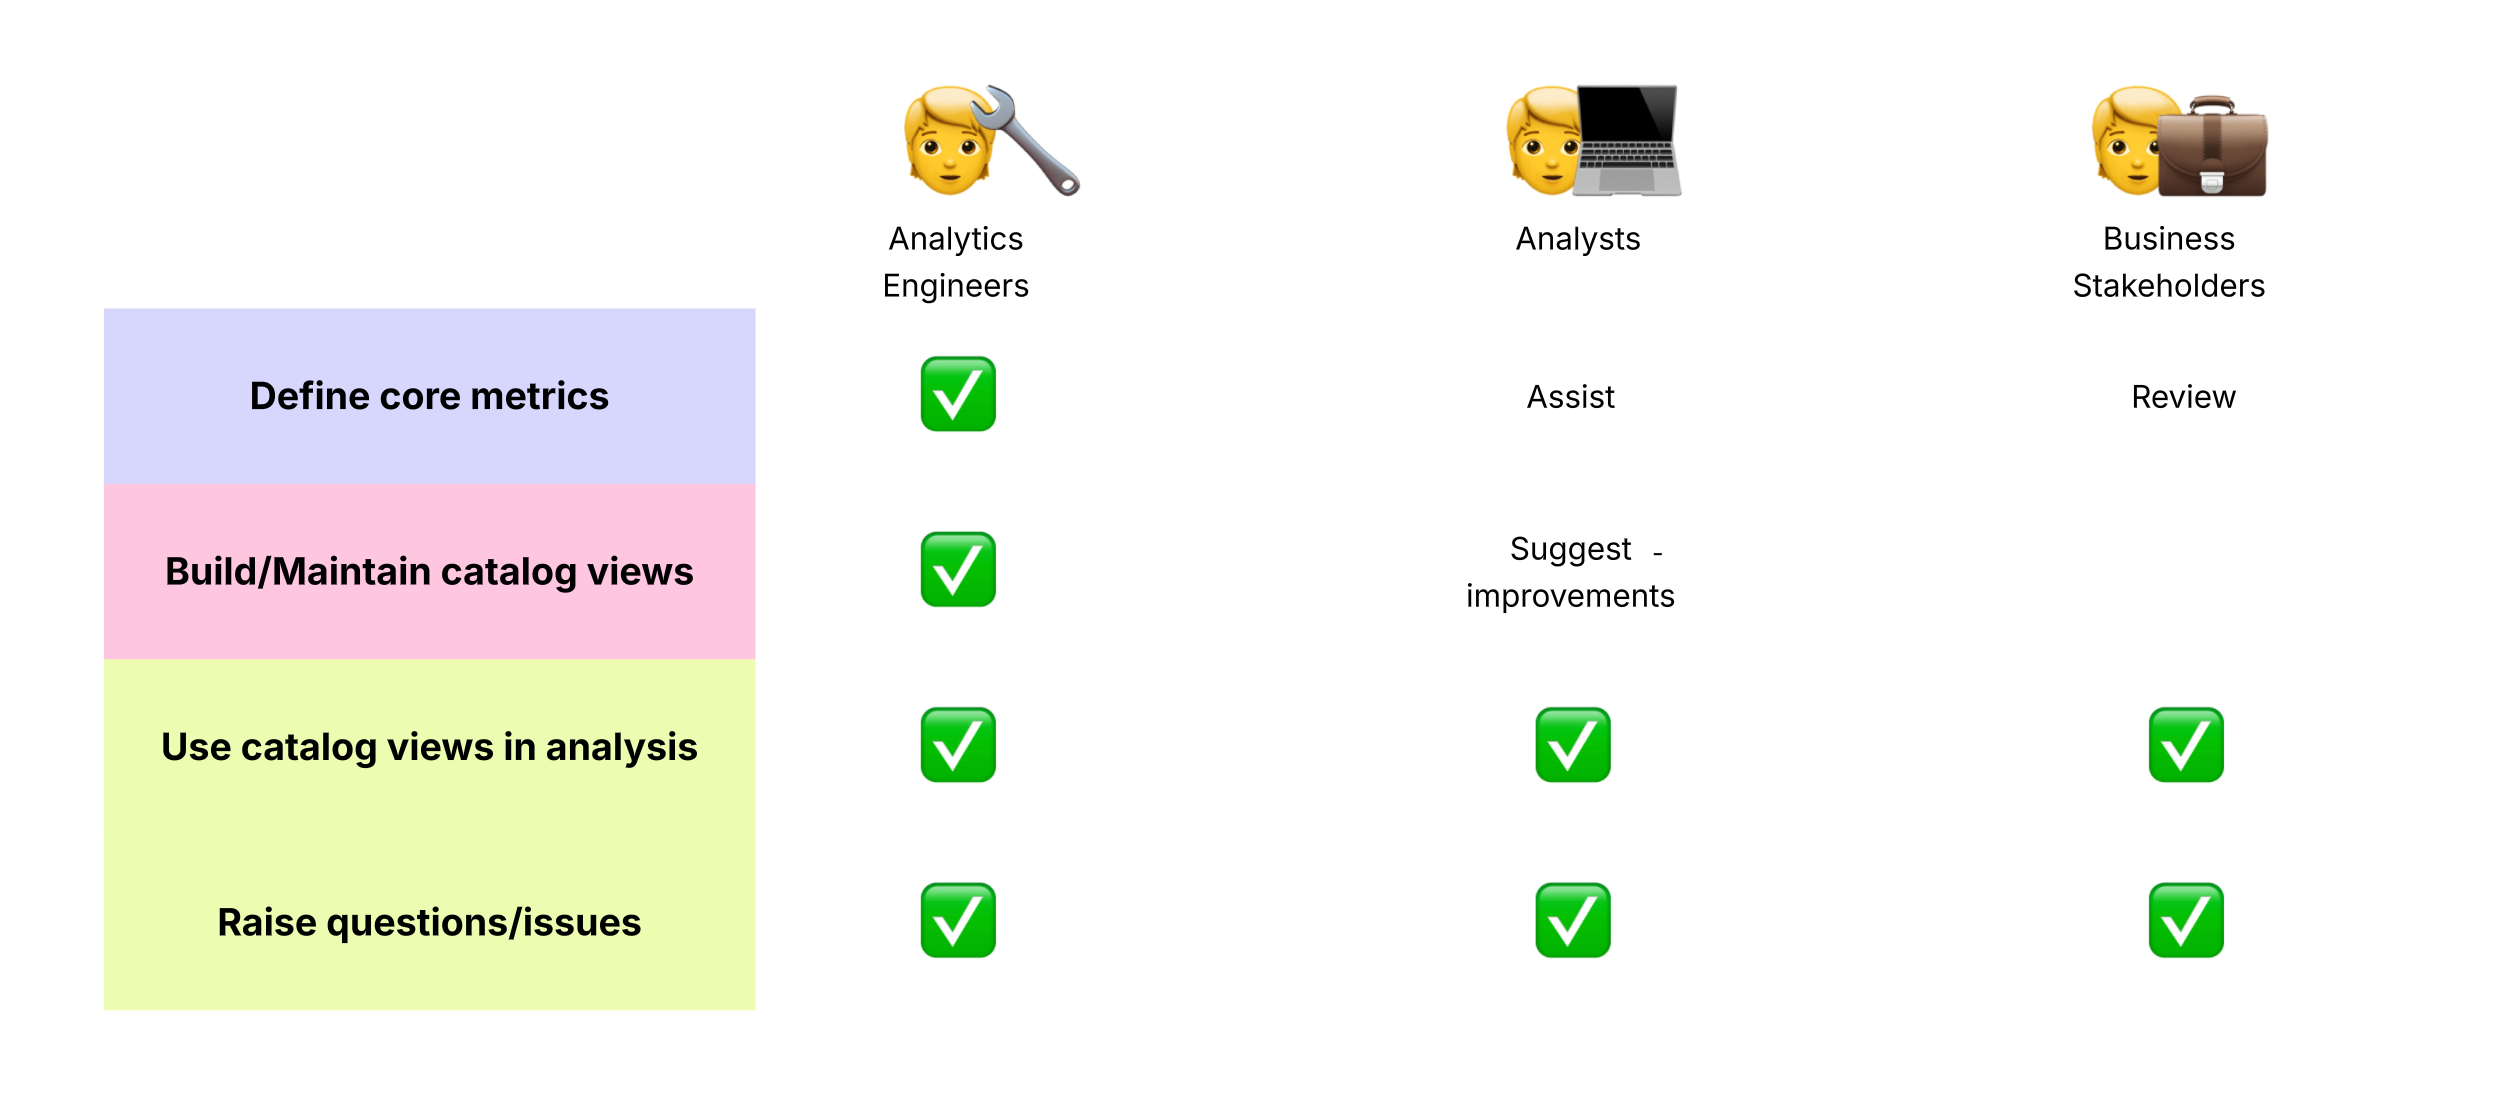
Who's Involved?
Well, anyone can do anything, really. We’re not here to tell you what you can or can’t do. But in practice, you’ll usually find that responsibilities tend to fall into a few natural patterns.
What should be included?
Good places to start when deciding what should be built out in your semantic layer are:
- common metrics
- frequently reused logic
- business critical KPIs
- Anything that causes confusion!
Focus on building your catalog around common metrics, frequently reused logic, and business-critical KPIs. Prioritize definitions that reduce confusion across teams. Start with what’s most impactful and broadly shared, so everyone benefits from consistent, trusted data.
We'd strongly recommend leaving these out:
- ad hoc/one off metrics
- experimental logic
- sandbox work
- edge cases
Skip ad hoc, experimental, or one-off metrics. Don’t include sandbox work or edge cases, as they clutter the catalog and undermine clarity. Keep the scope focused on what’s stable, valuable, and widely used. This ensures your catalog remains a reliable foundation for decision-making.
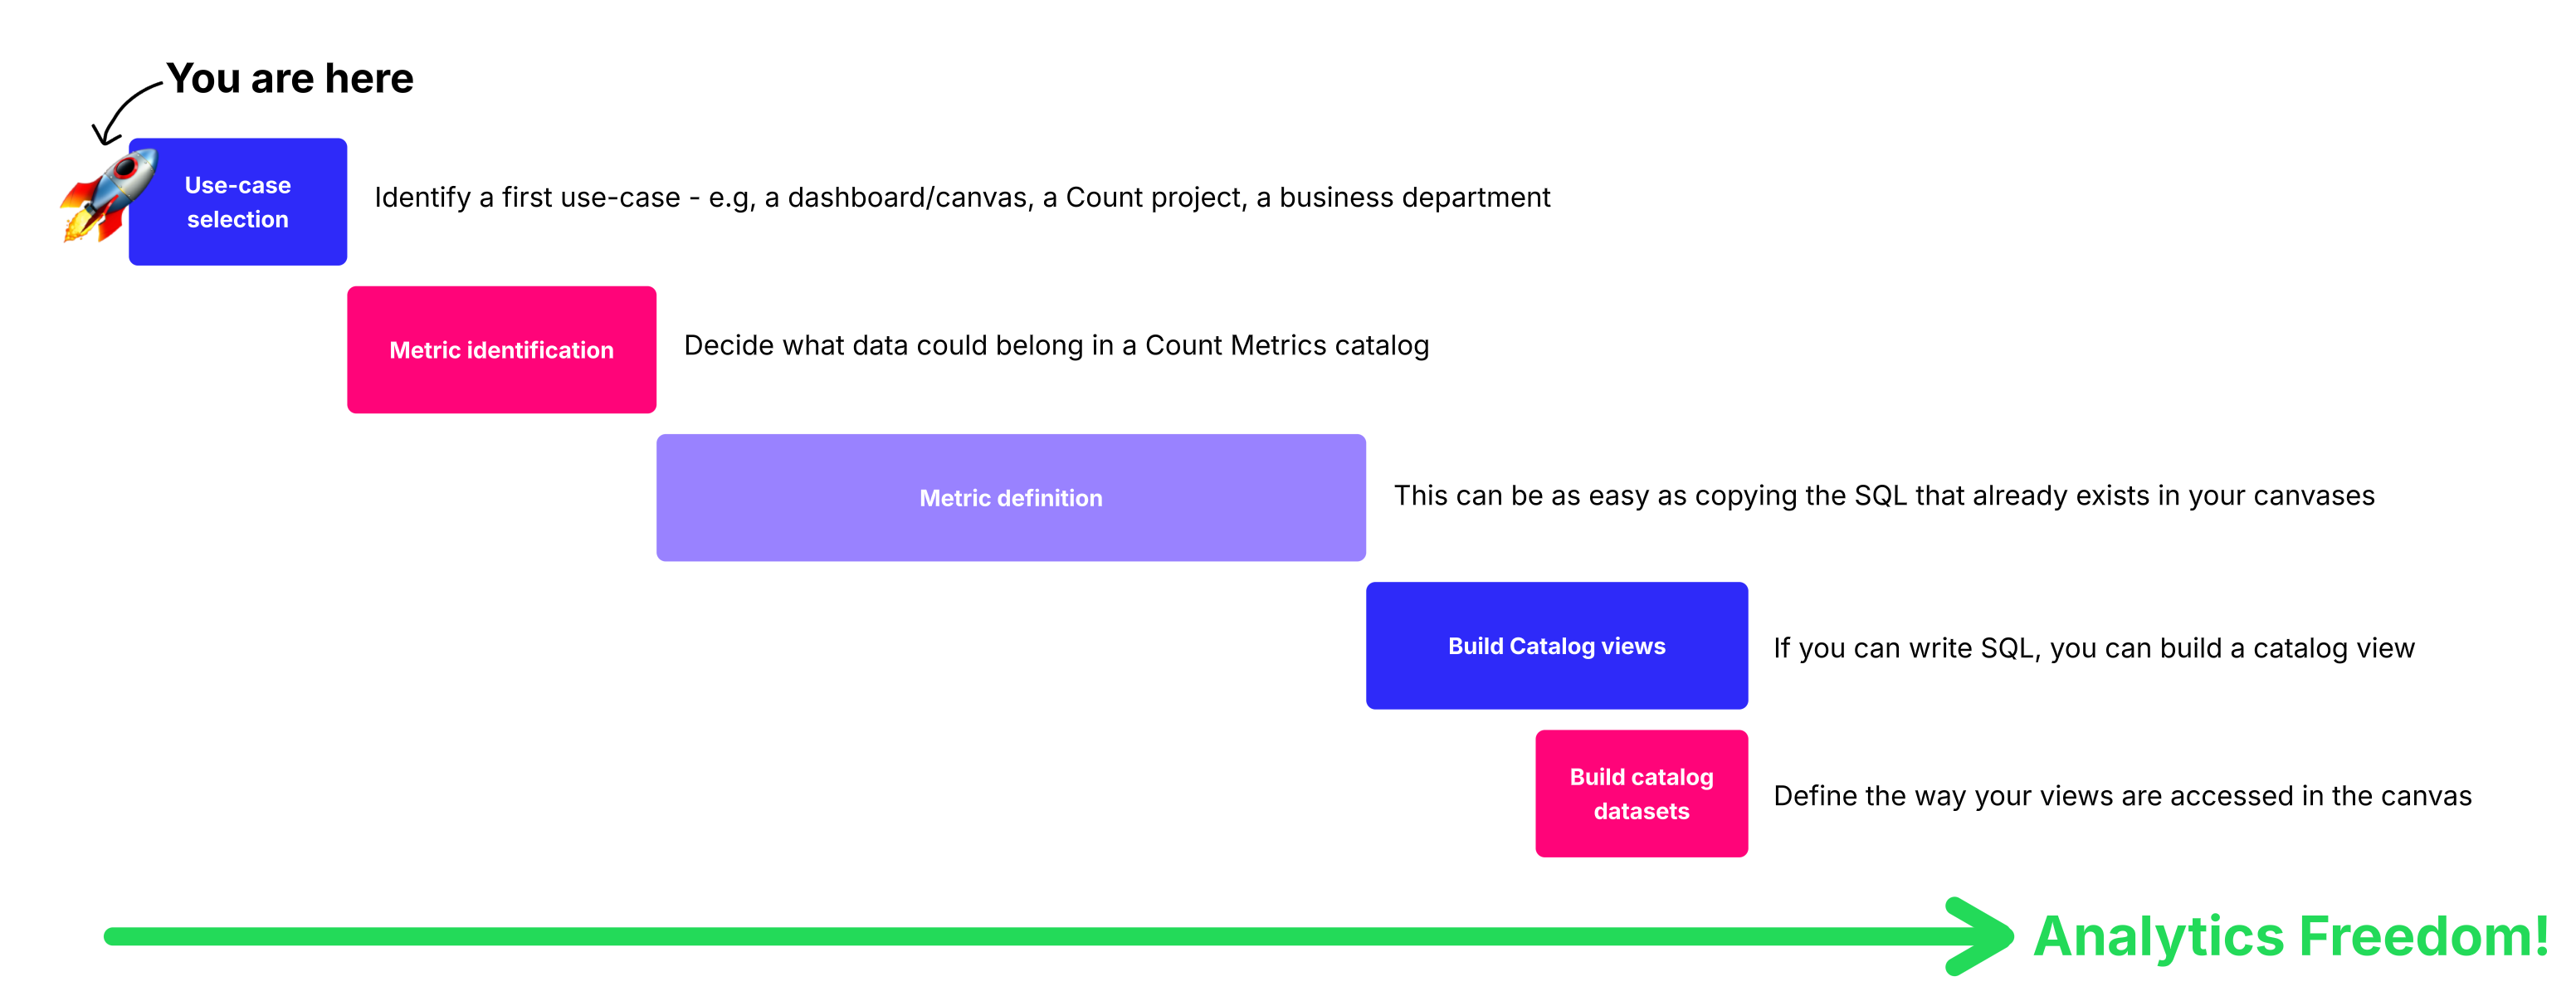
Ready to get started?
Whether you want to explore the docs, chat with us, or get hands-on support, we’ve made it easy to take the next step.
For more details and step-by-step guidance, check out our docs to learn how to get started.
Read the docs
For more details, check out our docs to learn how to get started on how to build and edit your first catalog, customize views and datasets, and setting up your caching configuration.
Talk to us
Have any questions? Reach out to us via:
- Slack
- Our in-app chat support
Need hands-on help?
We can help you design and build your semantic layer fast. You get to skip the setup and jump straight to the value.
👉 To enquire: reach out to us via slack, email or our in app chat support