What is the Improvement Cycle? (and why should you care?)
Break the service trap
Many data teams get stuck in a reactive “service loop”—shipping more reports, answering every question, and optimizing things the business can’t see, which creates confusion and low ROI.
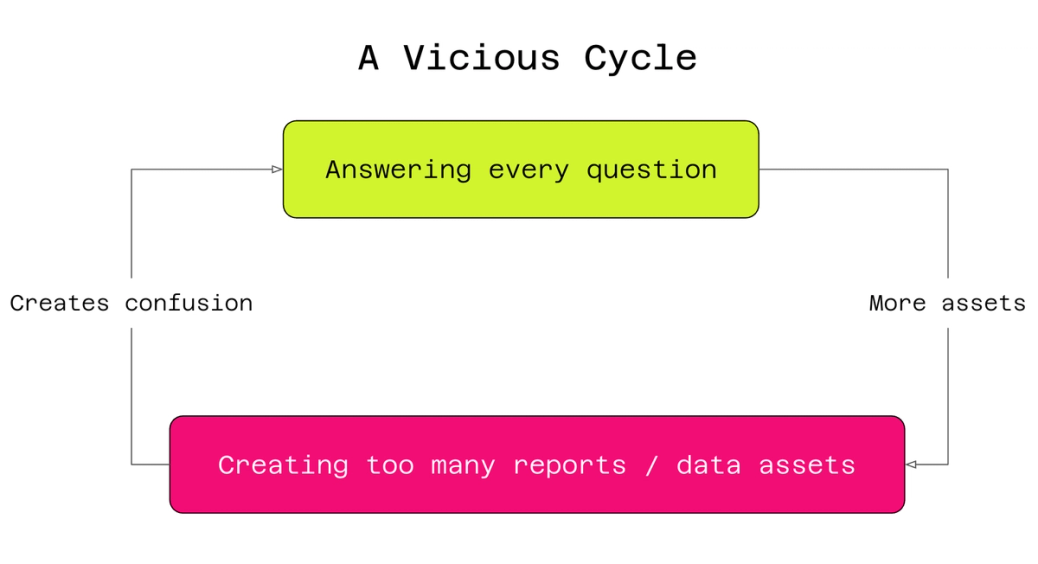
Forward-thinking teams flip the script: they bring clarity, tackle real business problems, and build a culture of continuous improvement.
The Improvement Cycle (what good looks like)
A simple, repeatable loop to drive measurable change:
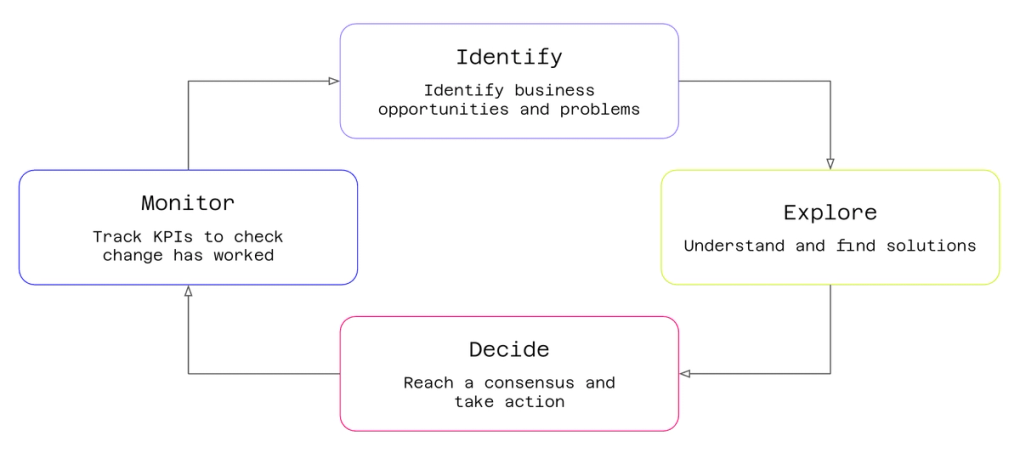
- Identify – surface opportunities and problems worth solving.
- Explore – understand causes, test ideas, and find solutions.
- Decide – reach consensus and take action.
- Monitor – track KPIs to confirm the change worked.
When the business can “see itself” clearly (e.g., via metric trees), the whole loop flows faster.
How Count powers every stage
Identify
- Map the business with metric trees, funnels, and flow charts to make complex operations feel simple.
- Capture goals, assumptions, and context on the same canvas as your data.
- Align stakeholders in real time with comments, @mentions, and review requests.
Explore
- Query live sources with SQL/Python; branch ideas without losing context.
- Iterate quickly with DuckDB on-canvas to cut warehouse spend.
- Low-code exploration to build charts and tables without writing SQL.
- Use governed metrics to pull trusted definitions into analyses.
Decide
- Turn the working canvas into a polished, interactive presentation with Present mode—no export round-trips.
- Show lineage and steps so decisions are transparent and defensible.
Monitor
- Convert the decision into live scorecards/alerts on the same canvas.
- Track outcomes against the metric tree; close the loop and teach the organization what worked.
- Bring in dbt models inside the canvas (browse/reference models, view lineage/tests) to keep everyone on the same page.
Results you can expect
- Operational clarity (less noise, clearer priorities)
- Faster time to decision (shorter feedback loops)
- Higher ROI from analytics work (measure speed, quality, and costs)
- Reusable knowledge via governed metrics and shareable canvases