Data sidebar
The data sidebar gives you quick access to your catalogs, databases, schemas, tables, fields, and the cells in your canvas.
- You can resize the data sidebar by dragging the right-hand edge, or adjust the divider between the Tables and Cells panes.
- You can hide or show the sidebar using the arrow button at the top, or the shortcut Cmd + \ (Mac) / Ctrl + \(Windows).
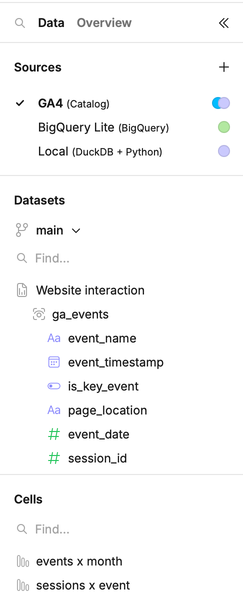
Tabs
- Data – Displays your available data sources, tables, and cells.
- Overview – Shows a summary of the sources and objects used in your canvas.
Sources
The Sources pane lists all catalogs and database connections available in your canvas.
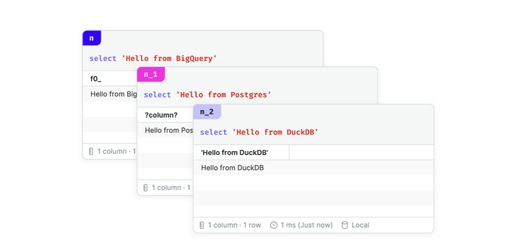
- Active source – Selecting a source makes it active. Any new cells created from the toolbar default to this active source.
- Colors – Each source has a color used to visually distinguish its cells in the canvas.
- Click a color to edit it.
- Default source colors can also be set in the database connection settings.
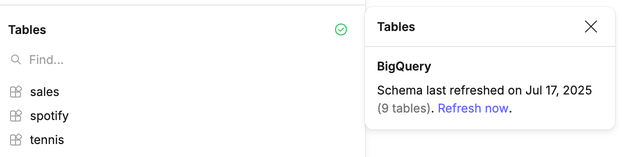
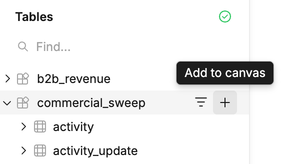
Tables
The Tables pane lists the available tables for the active source.
- For database sources, tables are grouped by schema.
- Expand/collapse schemas and tables to browse their fields.
- Use the plus button next to any schema, table, or column to insert a summary of that object directly into the canvas.
- Use the search bar to quickly find a table or field.
- Use the filter icon to limit the list by schema or table, then search within that scope.
- Refresh – Click the status icon at the top of the Tables pane to refresh the list of tables for the active source.
Schema display
- Click on a table to expand its schema and see all fields.
- Data types are shown next to each field (e.g. STRING, DATE, JSON). Analysts can toggle type display off in Preferences if preferred.
- Partitioning columns are shown in the sidebar when available.
- Expand array/struct fields to see their nested schema directly in the sidebar (BigQuery only).
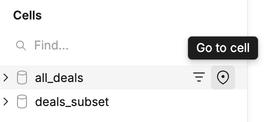
Cells
The Cells pane shows the list of cells for the active data source.
- Use the search bar to find a specific cell.
- Click the navigation icon next to a cell to jump to it on the canvas.
- Use the plus button next to a column to insert a summary of that column into the canvas.