Layout and sizing
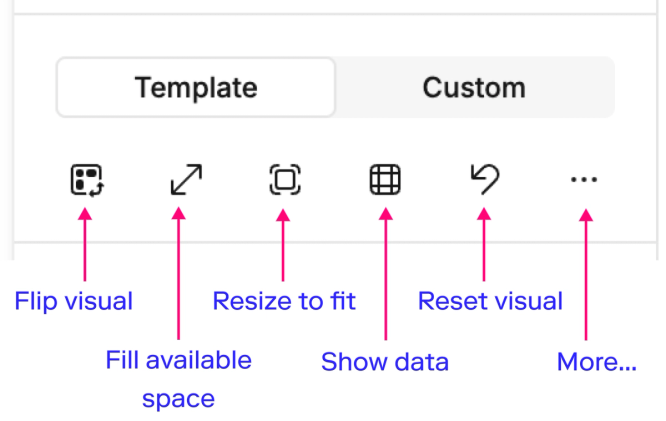
Quick options (icon set)
These options affect the placement, layout, and overall control of a visual in your canvas:
- Flip visual: Swap X and Y axes.
- Fill available space: Automatically resize the chart to fill the visual cell. The chart will continue resizing as the cell size changes.
- Toggle back to Fixed sizing using the same icon to keep the chart size static.
- Resize to fit: Adjust the visual cell size to neatly fit the chart.
- Show data: Display the underlying data table. Click again to return to the visual.
- Reset visual: Revert the chart to a blank state.
Additional options (... menu)
- Scroll anchor position: Set where the chart scrolls from (top, bottom, left, or right).
- By default, time runs left to right. New data may be hidden on the right; anchoring scroll to the right (or bottom) ensures the newest data stays visible.
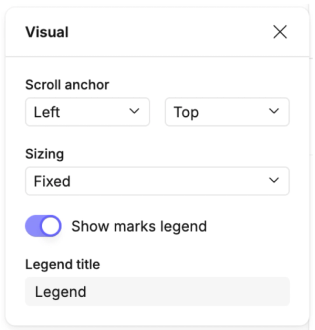
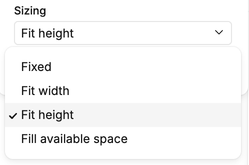
- Sizing: Provides more granular control over the chart size within the cell via dropdown options.
- Legend: Toggle the chart legend on or off, and edit the legend title when enabled. See Legends for full details on customizing them.