Performance optimization
This tutorial will walk you through settings and techniques you can use to make your canvases more efficient.
Tutorial summary
Learn essential techniques such as using caching, manual cell execution controls and query optimization methods to optimize canvas performance and reduce database load.
What you will learn
- Cache queries to reduce run frequency
- Execute cells manually to only run when required
- Use DuckDB to localize query processing
- Write efficient SQL and use compiled DAGs/hidden frames
- Optimize database configuration
- Monitor usage with telemetry
- Manage live queries actively
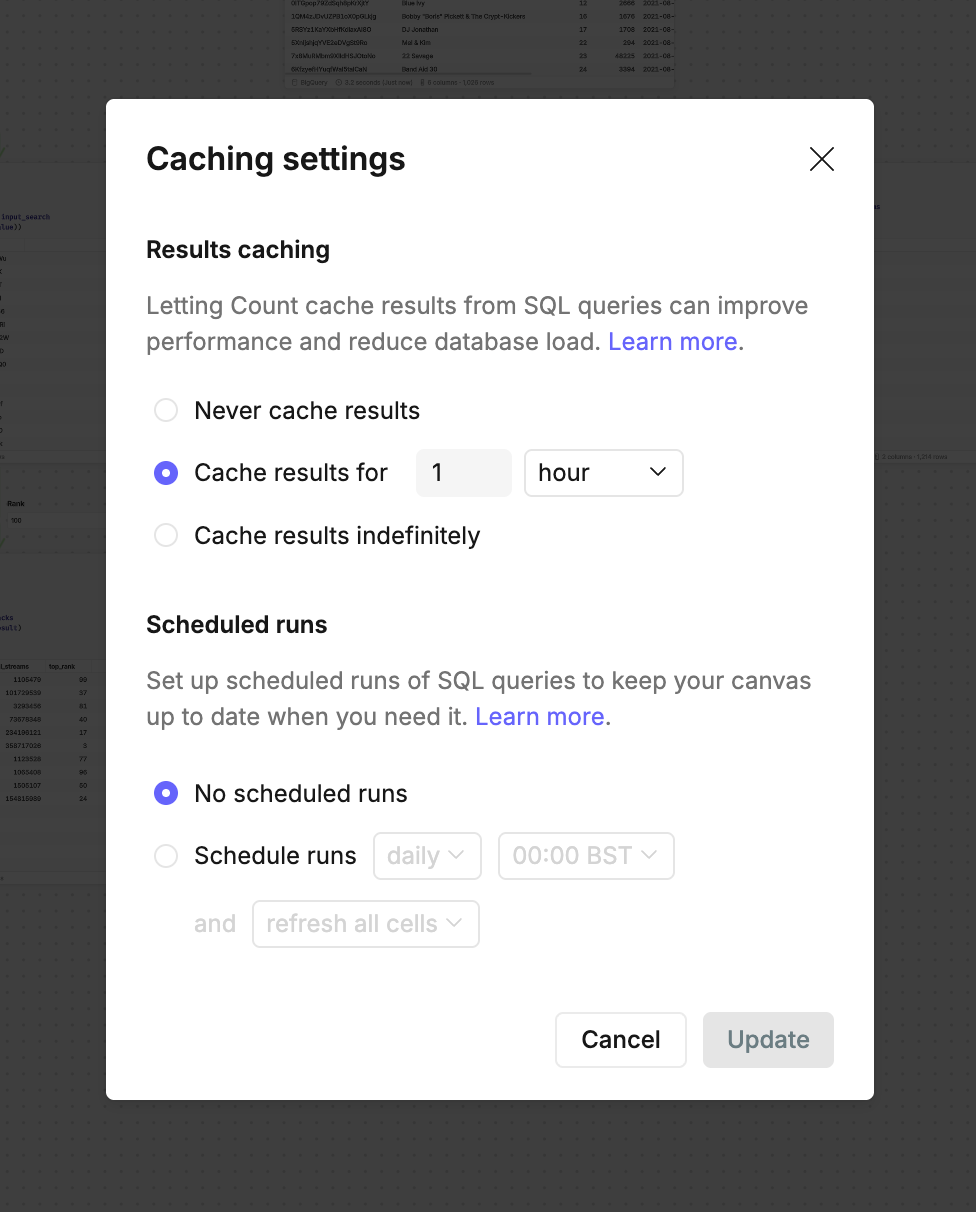
Caching and scheduling
Caching reduces the query load on your database.
- Never cache results - queries for visible cells are ran every time you open the canvas.
- Cache with scheduling - set cache periods (hourly, daily) and schedule query runs at optimal times for your workflow.
- Cache indefinitely - most efficient option where queries only rerun when you edit cells or manually execute them.
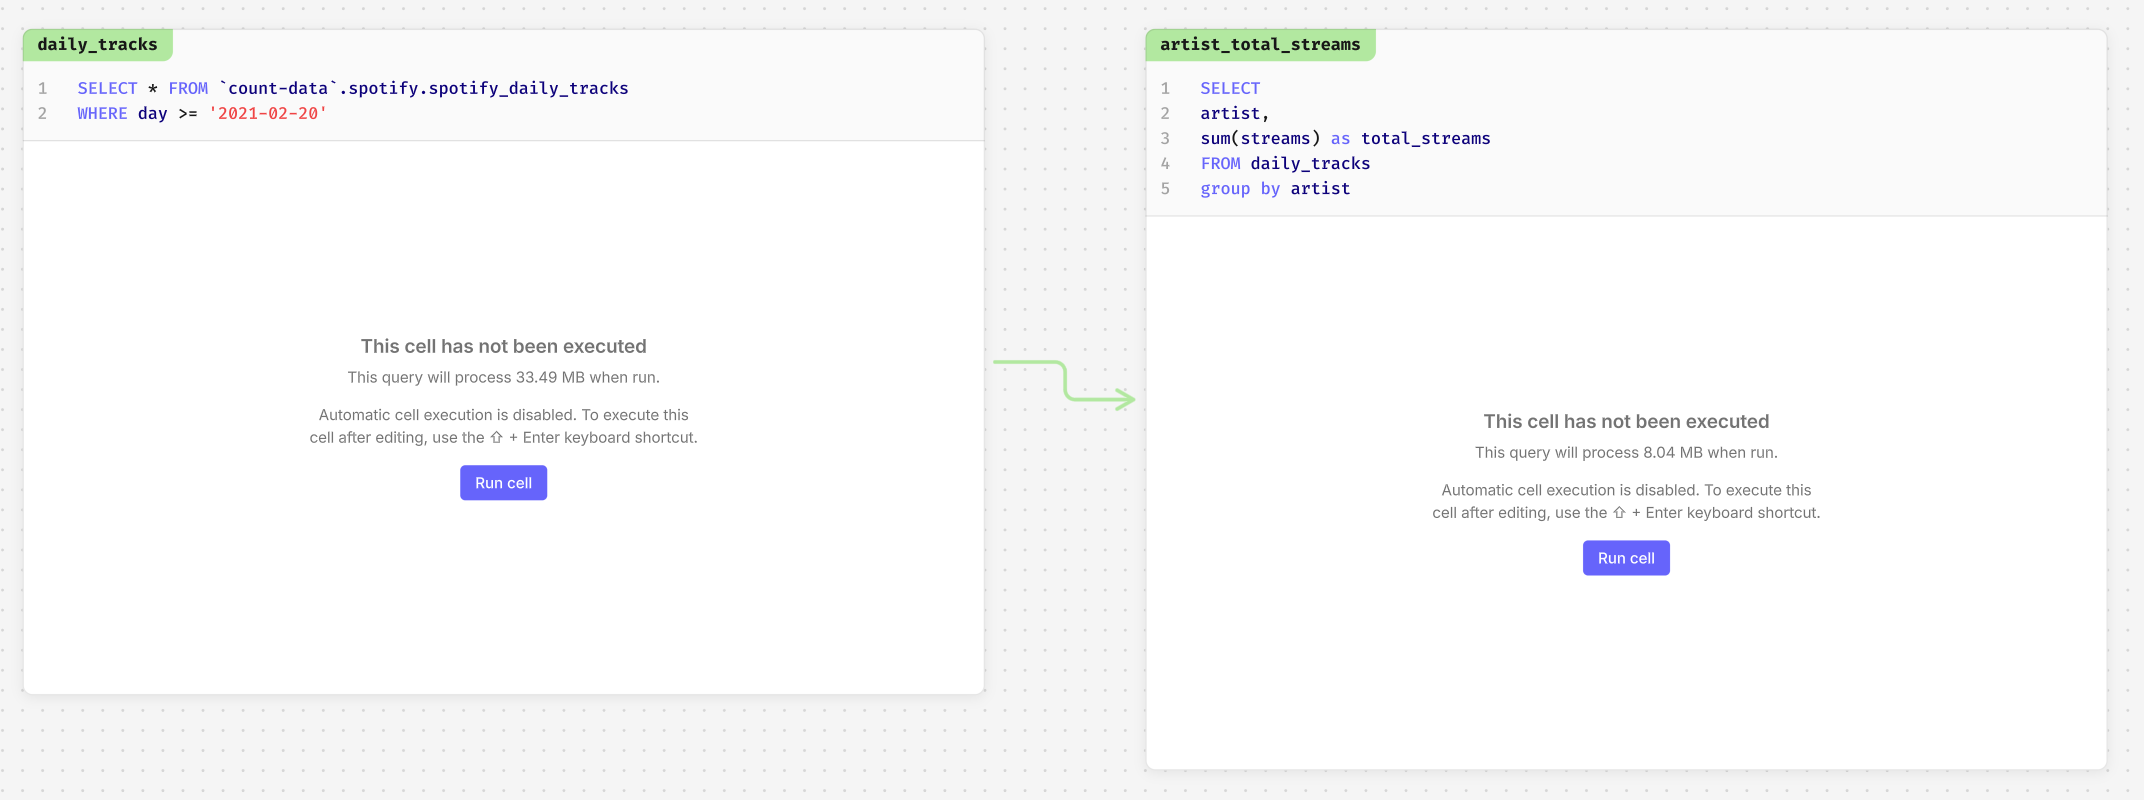
Manual cell execution
Use manual cell execution to control when your cells should run. Settings can be changed across the whole canvas, or at an individual cell level.
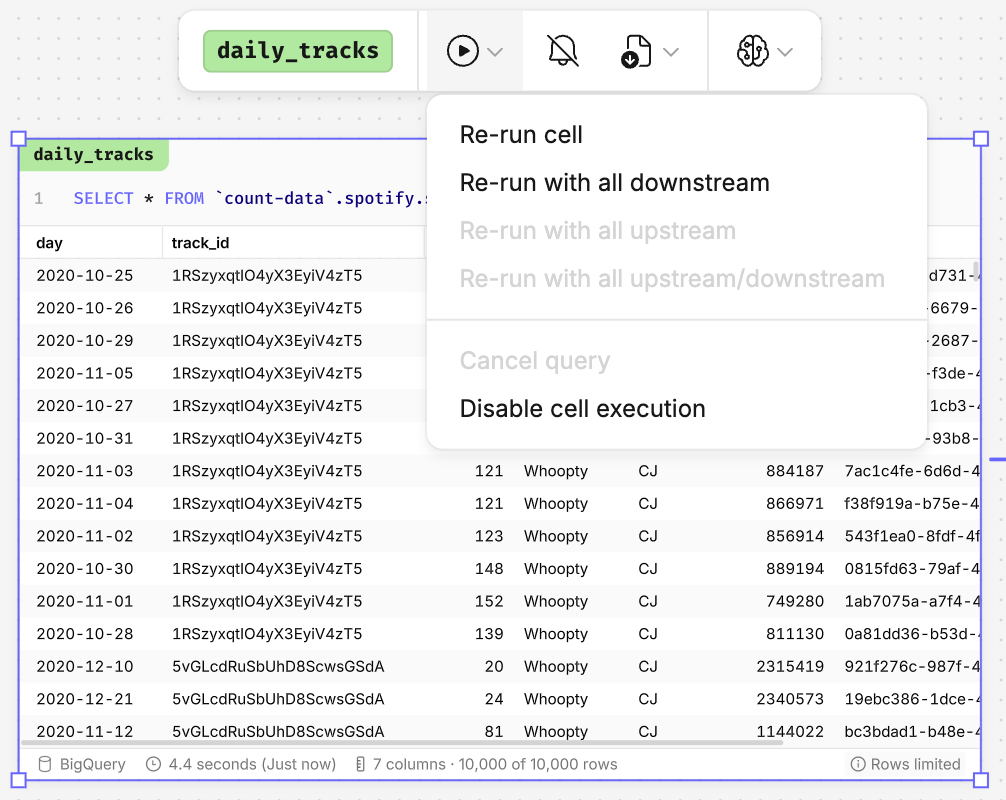
- Across the canvas - make changes without having all cells automatically run by toggling off 'Execute cells automatically' in Design. This will also impact any downstream cells.
- Individual cells - exercise more granular control and limit larger cells running every time by disabling individual cell execution, with all downstream cells still executing independently.
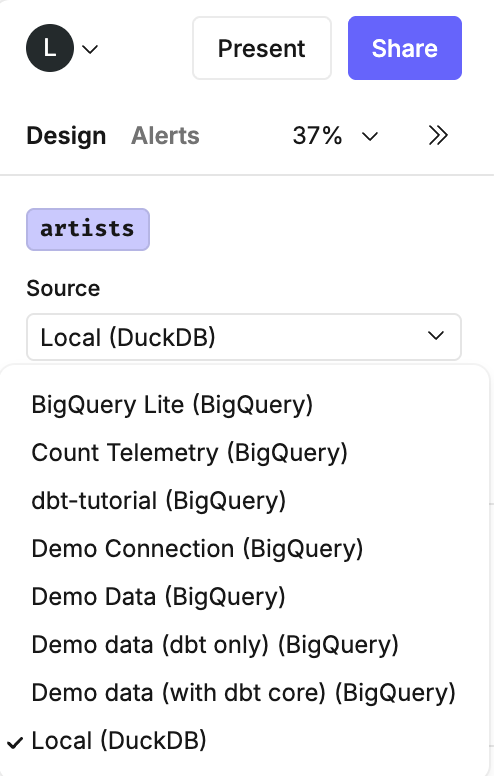
Utilize local queries
Use DuckDB alongside your database to unlock the freedom to do extensive analysis on your data without worrying about the query load going back to your database.
- DuckDB in the browser - convert database cells to local browser cells for fast performance (limited by 120MB memory).
- DuckDB in the server - operates in similarly to on the browser, however memory increases to 32GB, meaning you can have less initial database cells and switch over to local cells much sooner.
- DuckDB in Count metrics - cache at a workspace level so multiple canvases can make use of improved speed.
Reduce query loads
Employ these techniques to reduce your query loads.
- Reduce the amount of data returned - include filters as early as possible and avoid using
SELECT *to only return the data required. - Improve code efficiency - avoid resource-heavy joins like self-joins and cross-joins where possible.
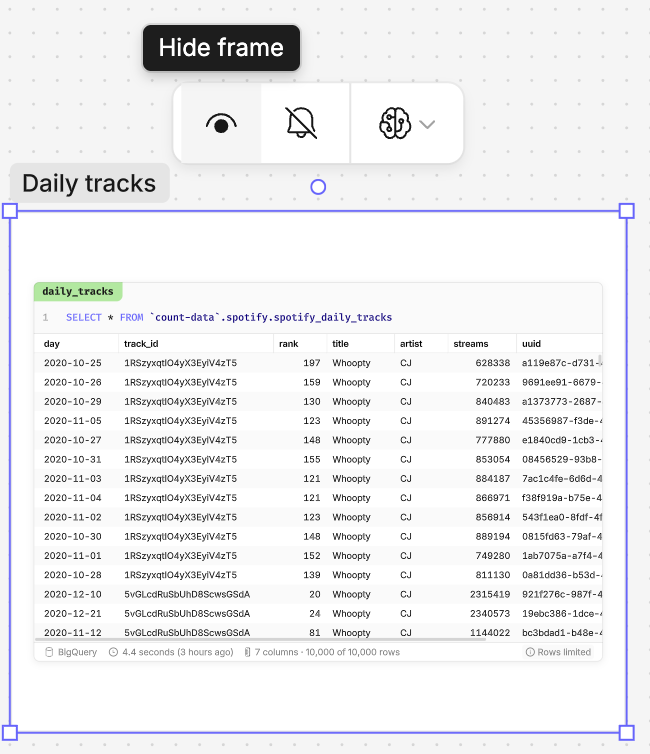
- Compile DAGs to fewer cells - use 'Copy SQL' to compile SQL from multiple cells into one cell to reduce database load.
- Use hidden frames - hidden frame cells only run when external cells depend on them, using them can keep analysis accessible whilst minimizing queries ran.
Database setup considerations
Improve the first point of call for more efficient queries.
- Improve the raw tables - use techniques such as indexing or partitioning, or create aggregated tables to use in Count.
- Optimize failure handling - Configure connection limits and timeout settings to fail slow queries faster, preventing resource waste.
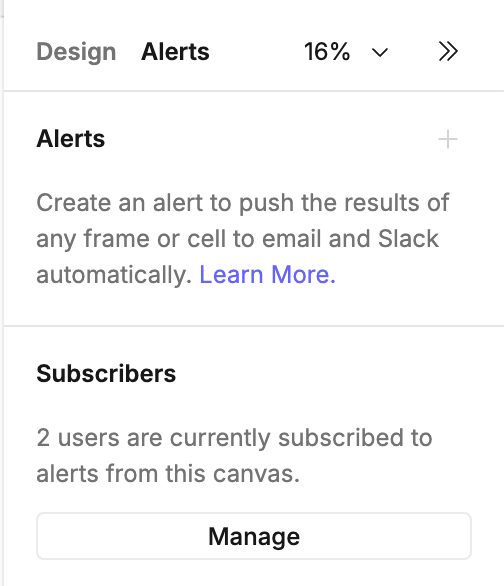
Monitor usage and performance
Count telemetry - if you're on Enterprise/Scale plan, you can access telemetry databases to monitor high-usage canvases, create usage reports, and set up timely alerts for relevant stakeholders.
Troubleshoot query performance
Improve performance through query investigation, which can be done at the following levels:
- Cell - click into individual cells to cancel queries at a cell level.
- Canvas - navigate to the logo drop-down -> Data -> cancel all pending queries.
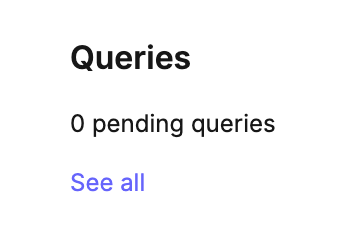
- Workspace - in your workspace go to Connections -> Queries, this will show all pending queries, where individual queries can be selected and cancel.