Managing and scaling your workspace
This tutorial will guide you through a number of key strategies and features you can implement to grow your workspace effectively.
Tutorial summary
Follow the below steps to understand how to structure your workspace to confidently bring in new teams, scale usage, and have the whole business working together.
What you will learn
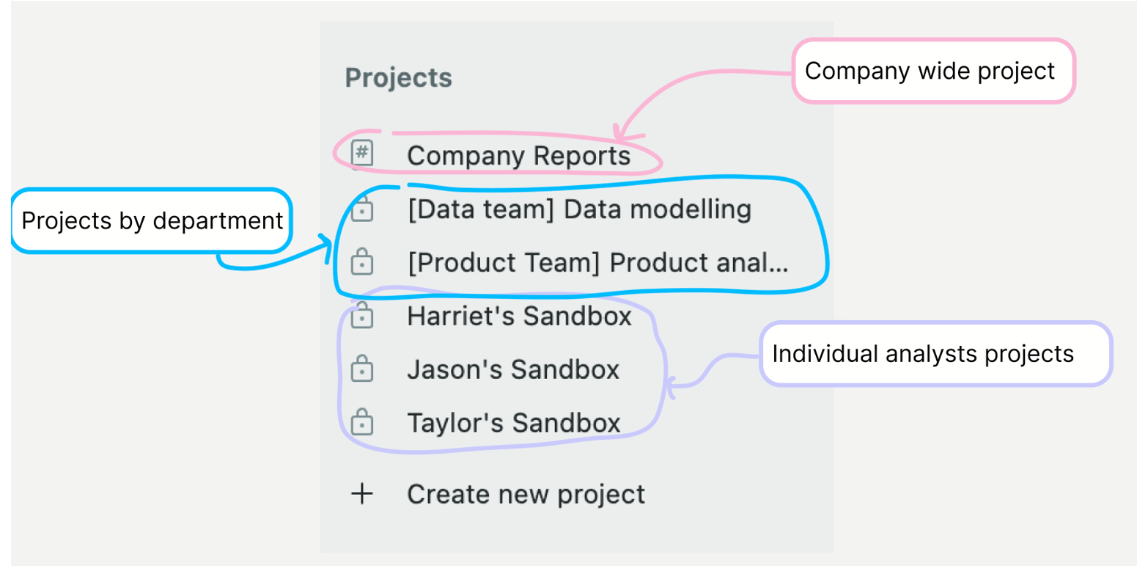
1. Create projects - use naming hierarchies to group canvases methodically and organise them into the right space. This could include projects for individual work, department / initiative work, and company-wide.
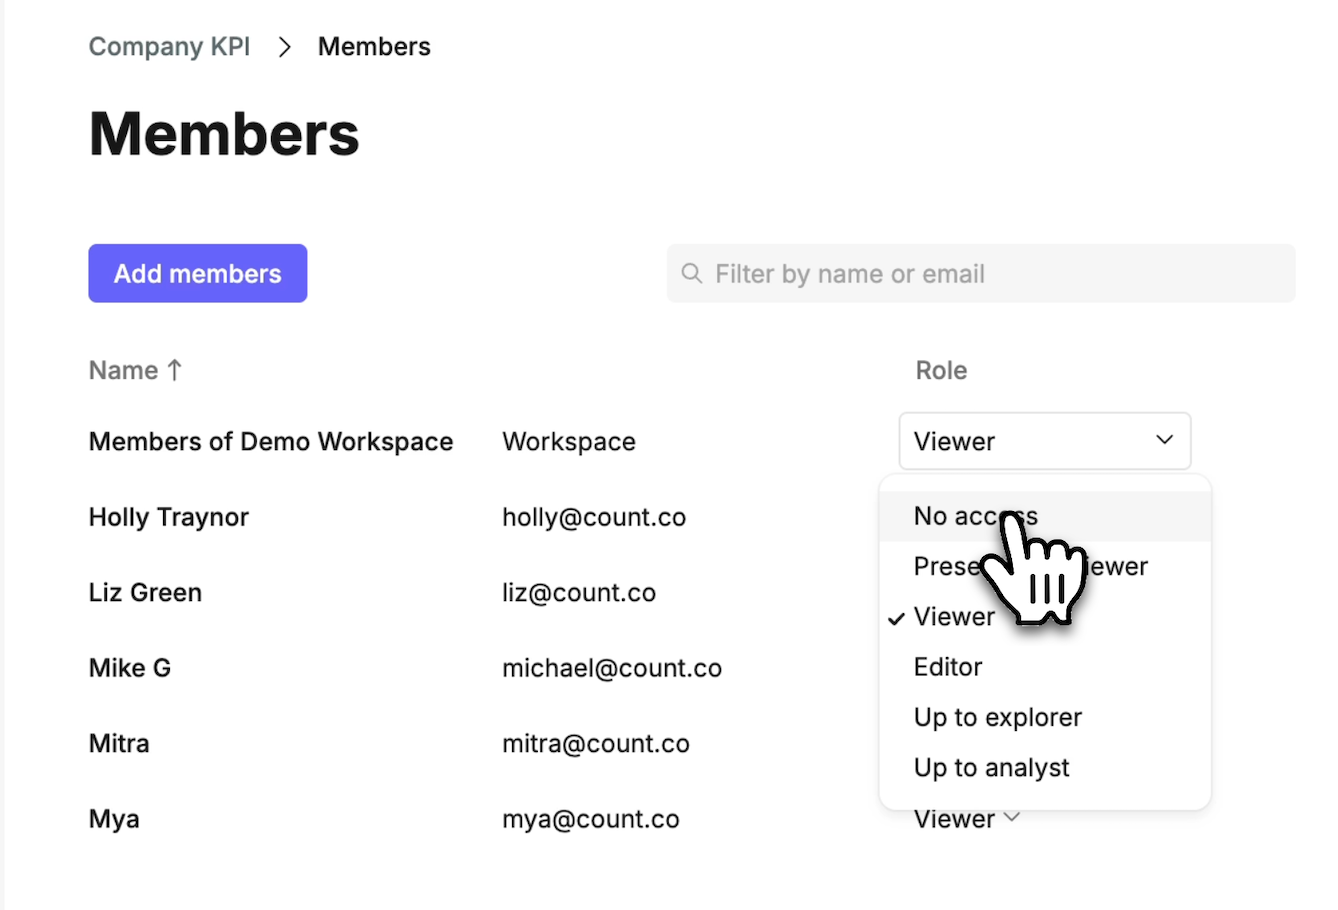
2. Use permissions - permissions can be set at different levels to give users access to the areas they need to see without creating too much noise in their workspace. Permissions can be set for workspaces, projects, groups and canvases.
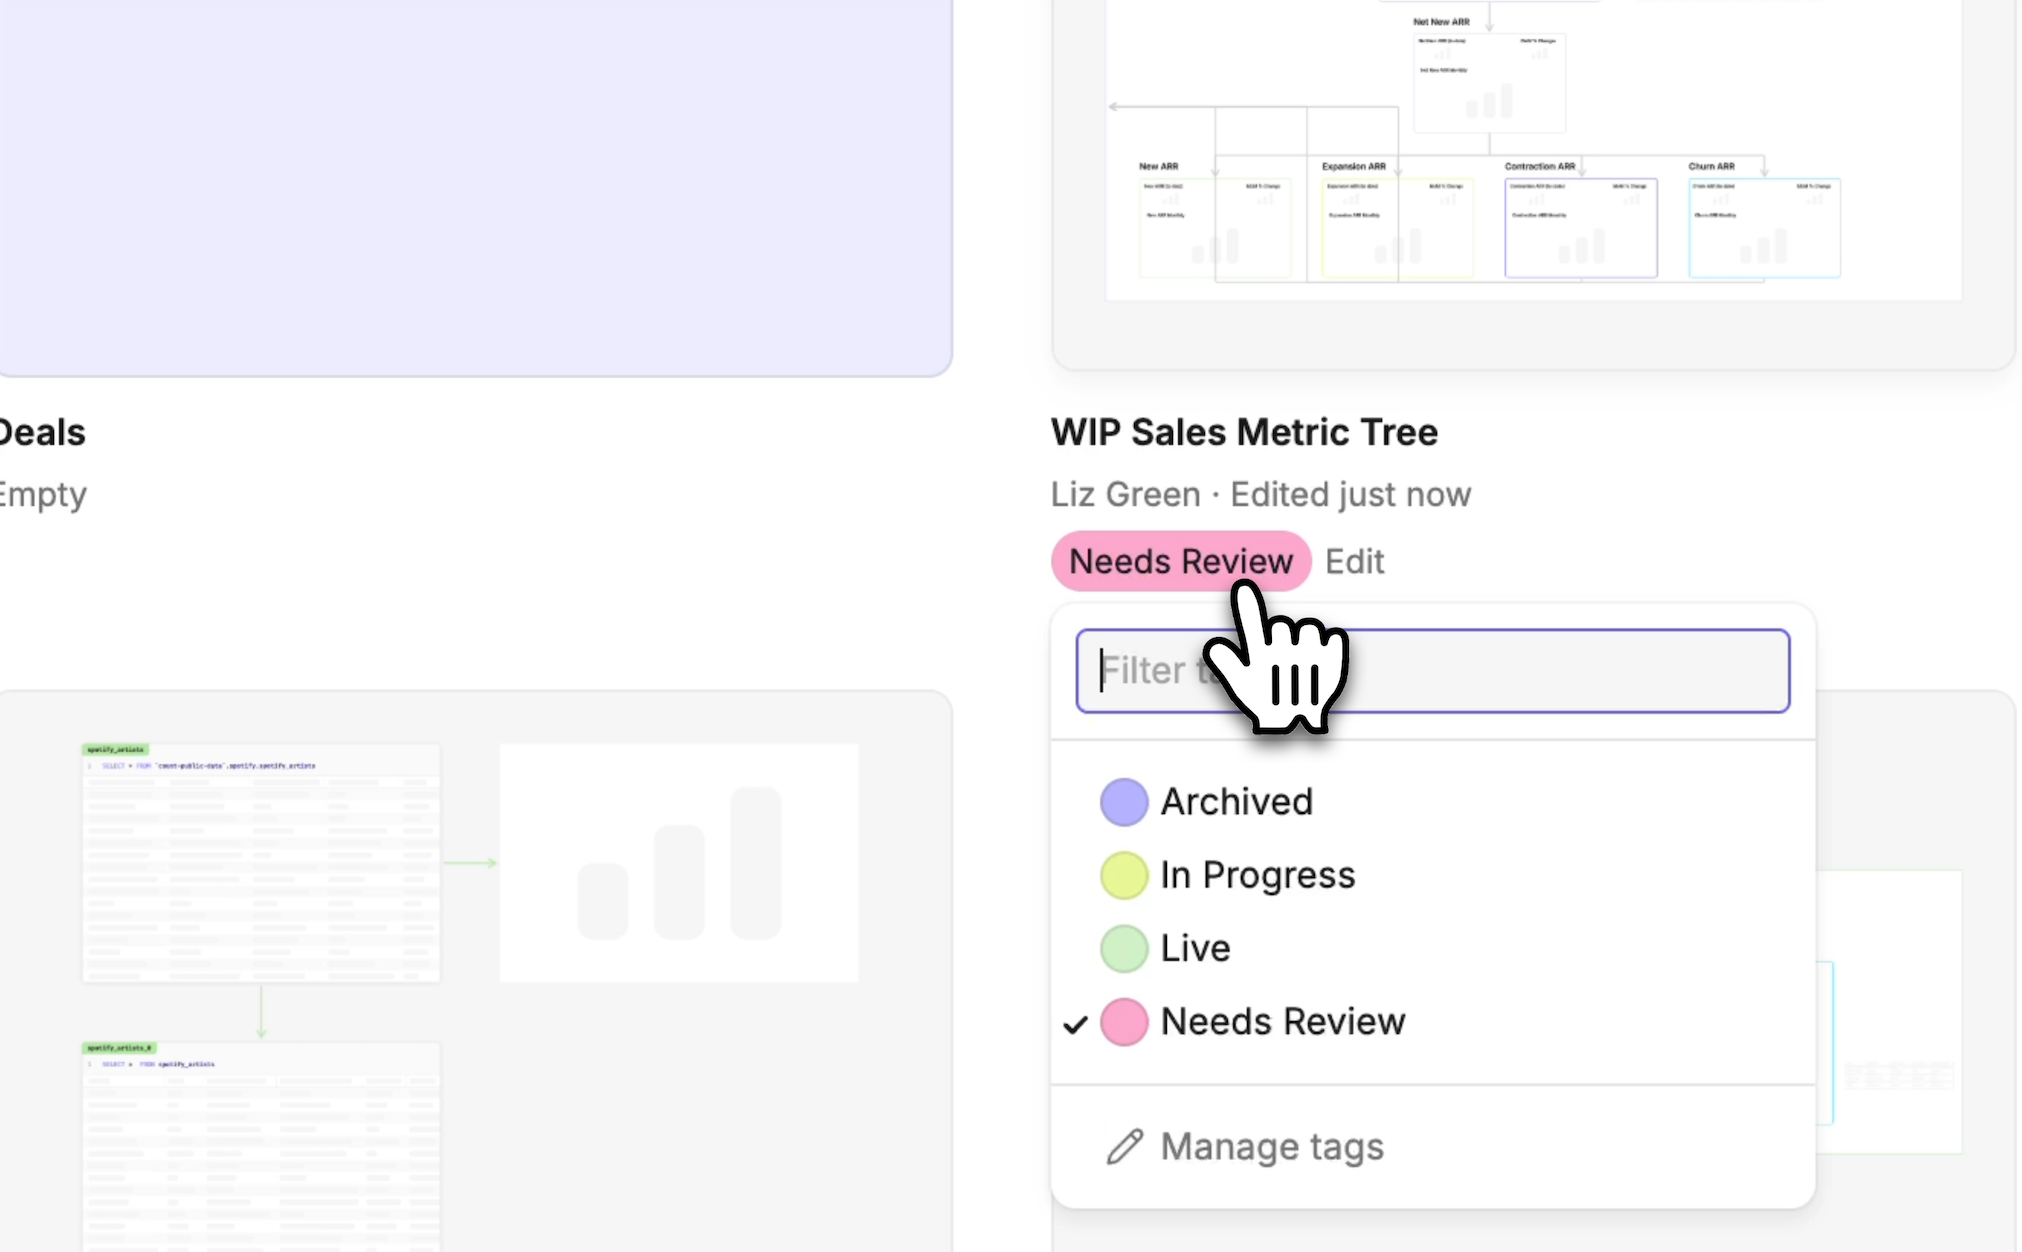
3. Make use of tags - tags allow users to organize their canvas. Tags are customizable, but could be used to show stage of production for canvases.This prevents outdated information being circulated, and helps maintain a clean canvas production line.
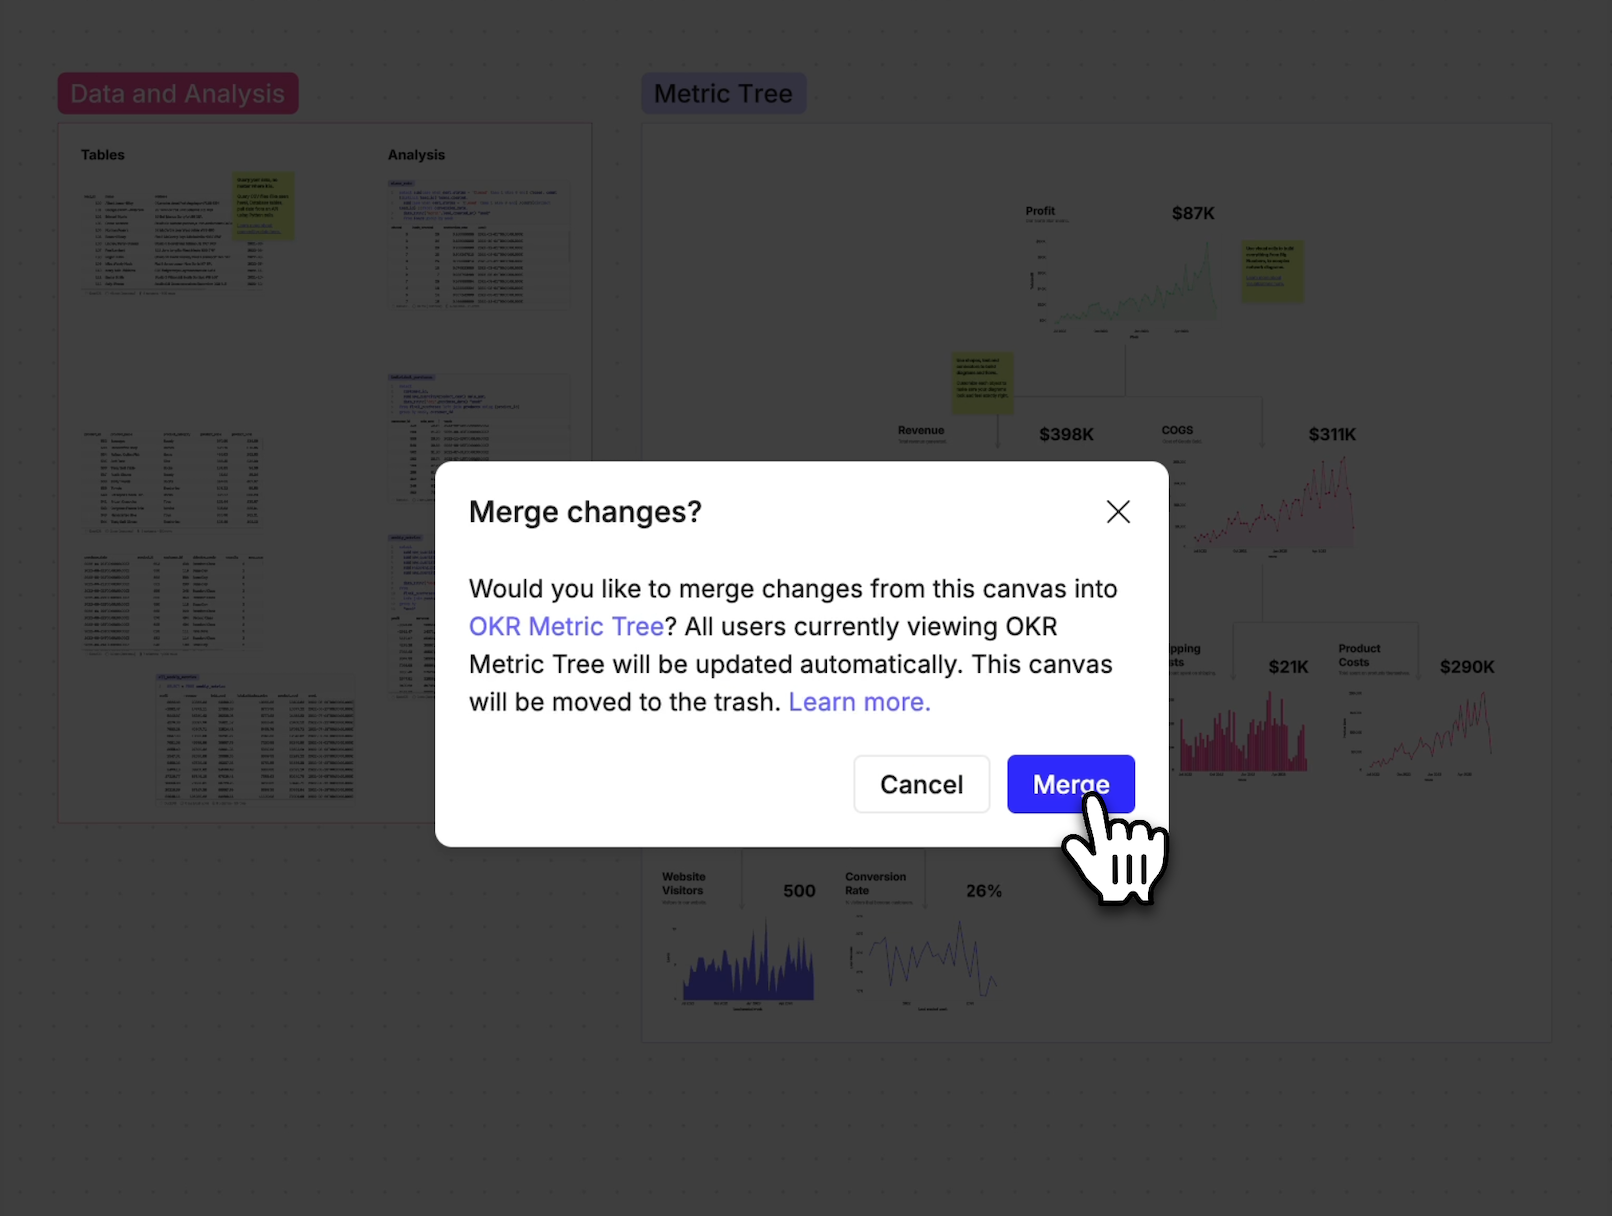
4. Duplicate and merge - edit and push changes without any downtime on your important canvases, keeping stakeholders happy that reports are working during updates. This also helps you retain version history to roll back if something has gone wrong...
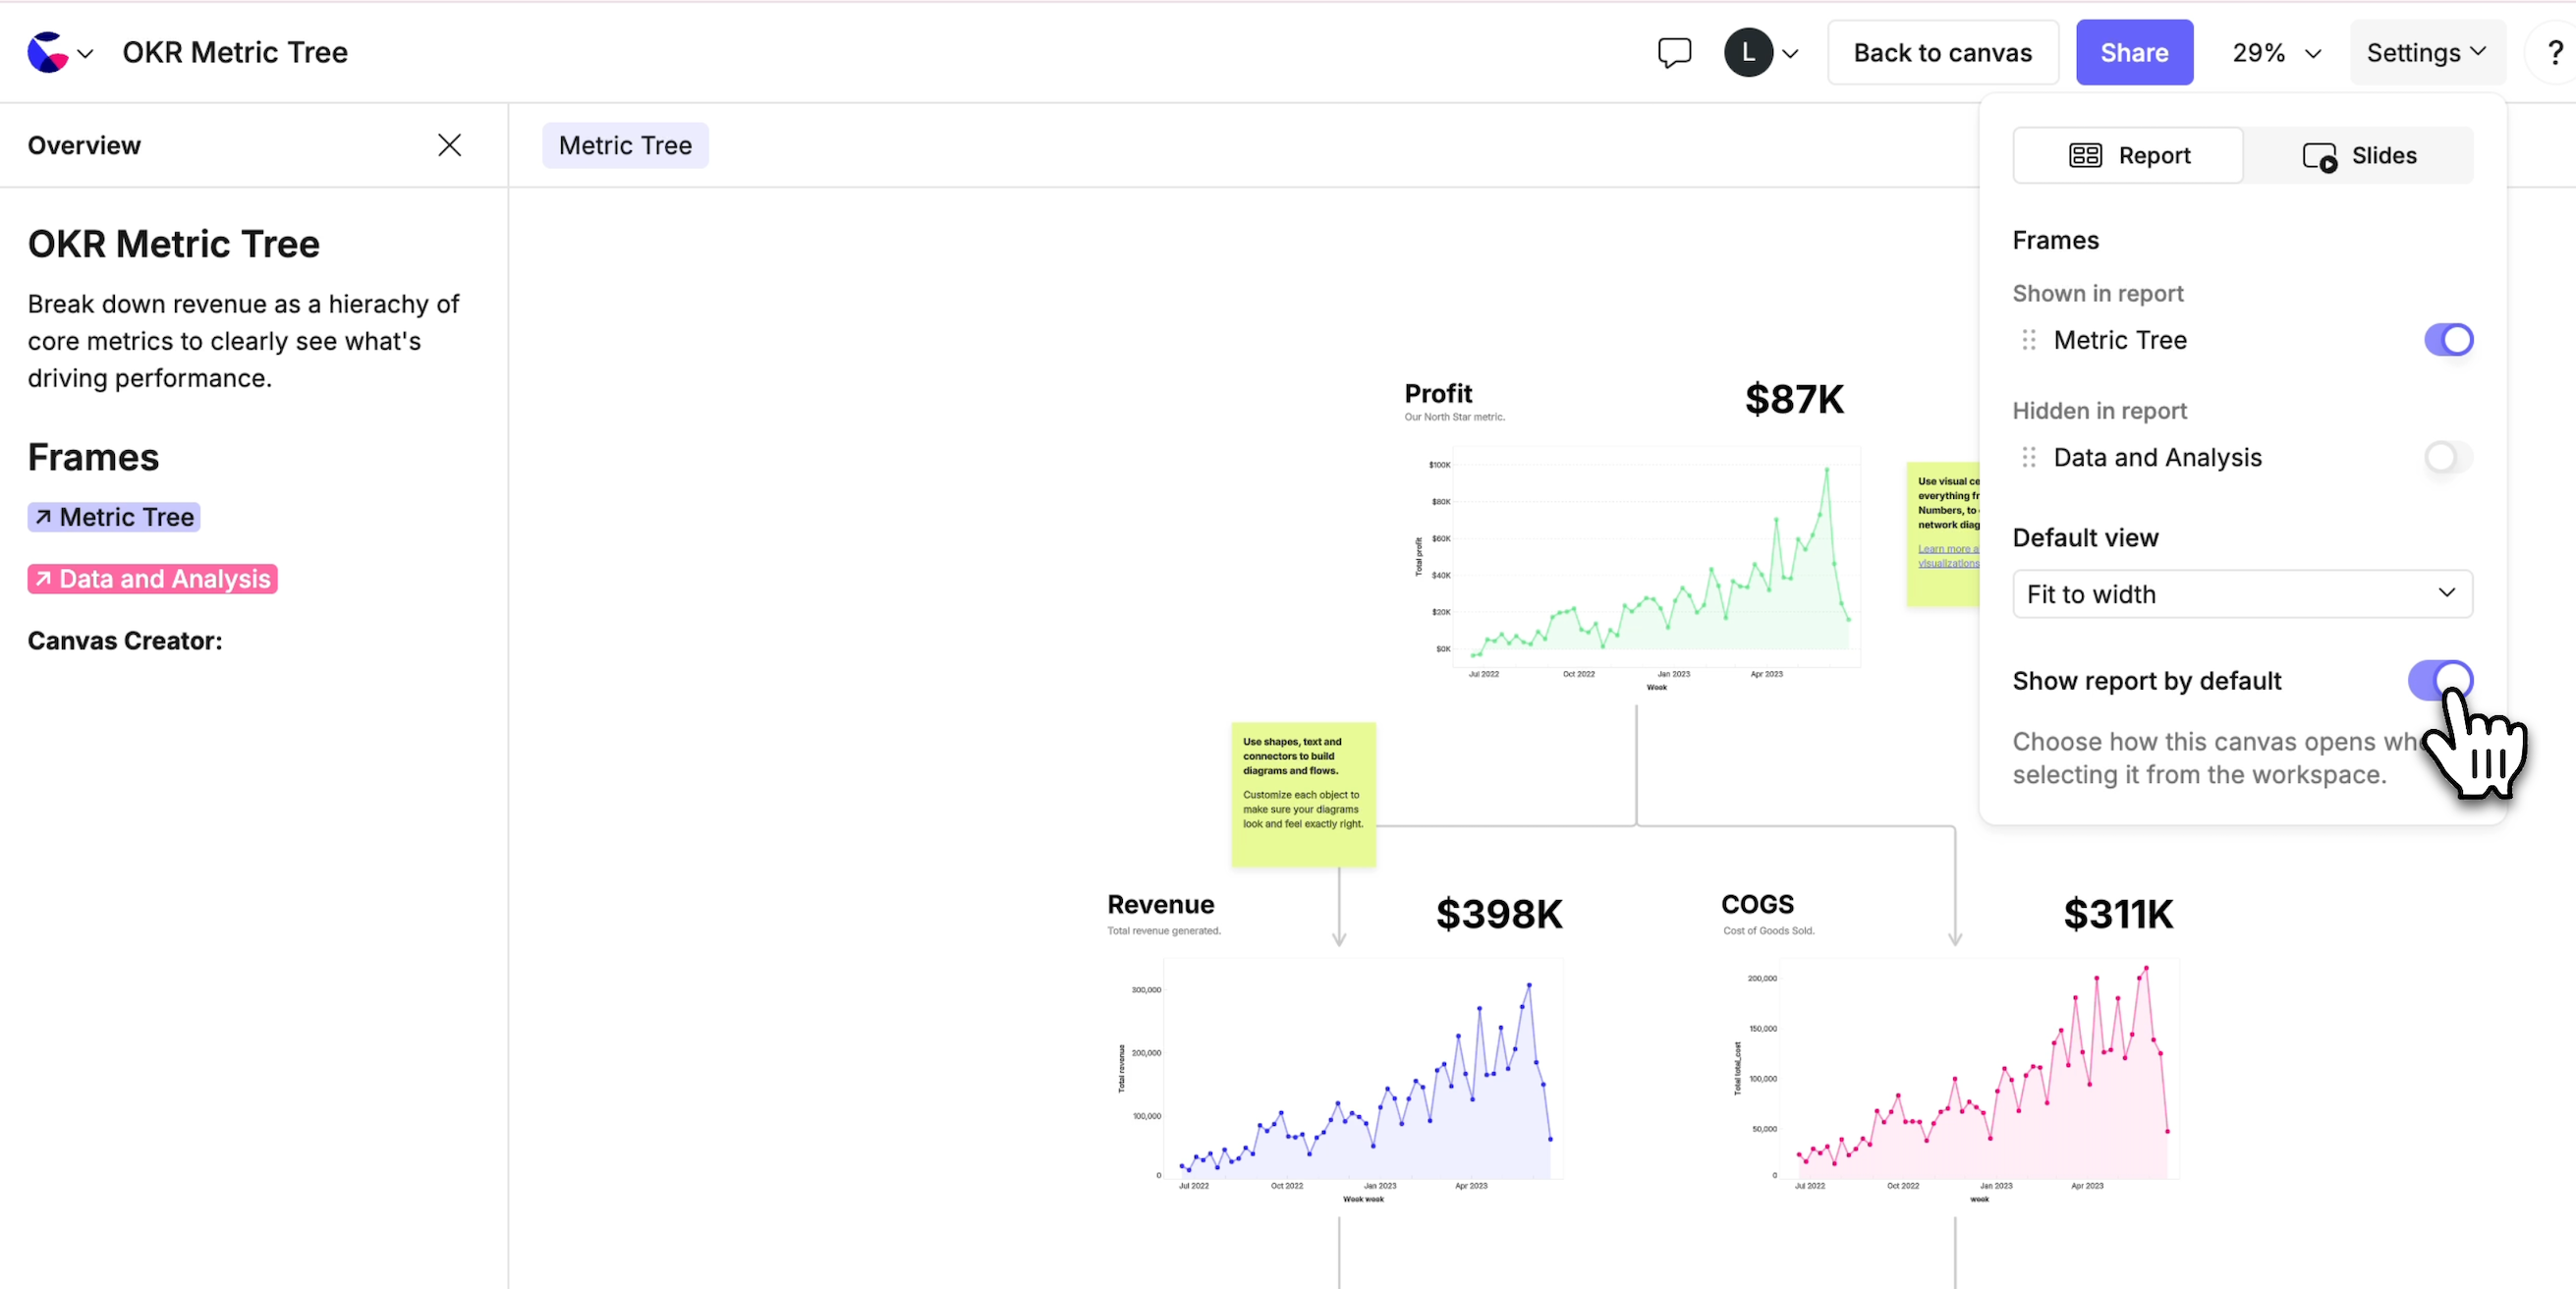
5. Use 'Present' view - Make your canvases look boardroom ready by using presentation mode, you can also set this as the default view.
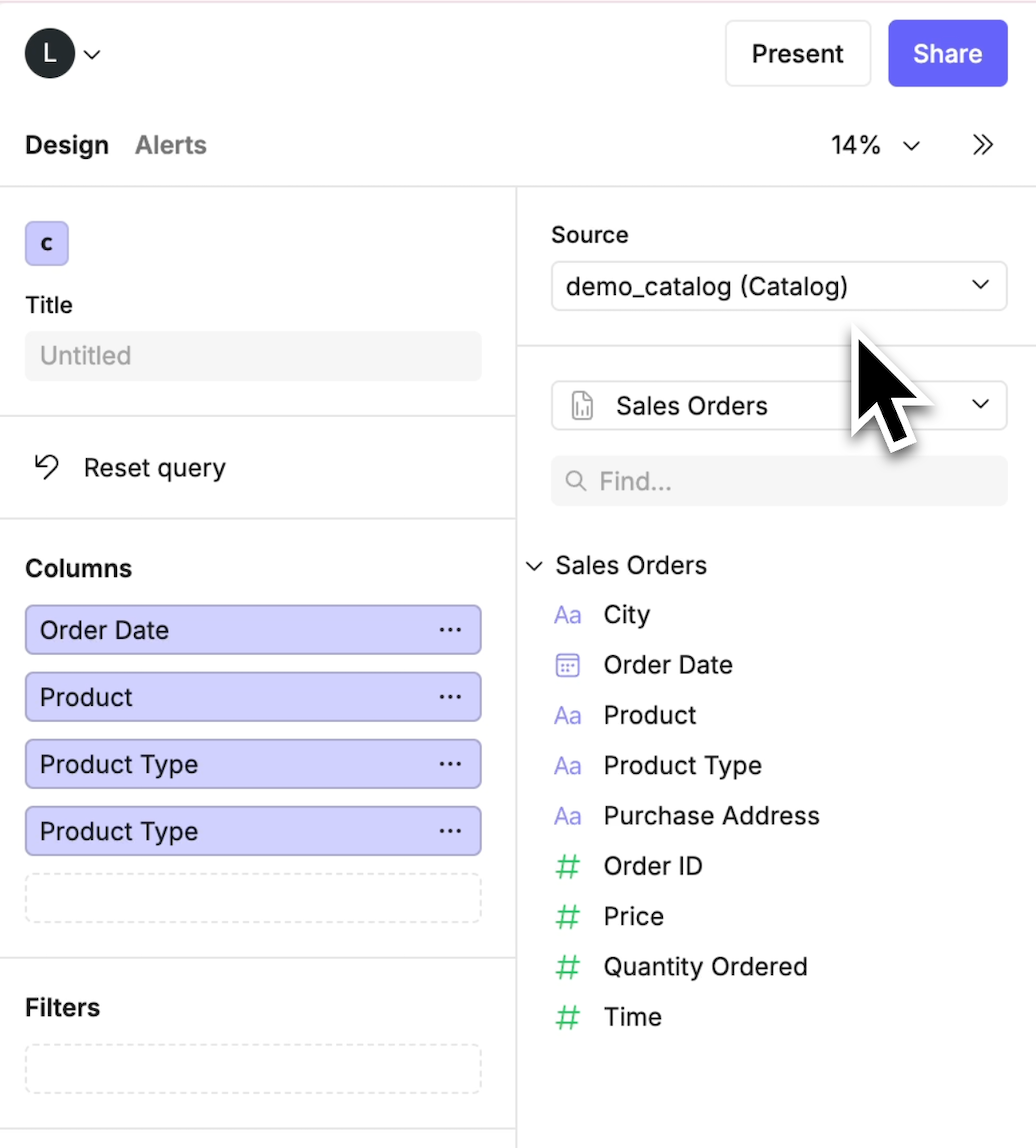
6. Build and use a Count Catalog - creating a set of pre-defined metrics means as you scale, your data is accessible and consistent for every team.
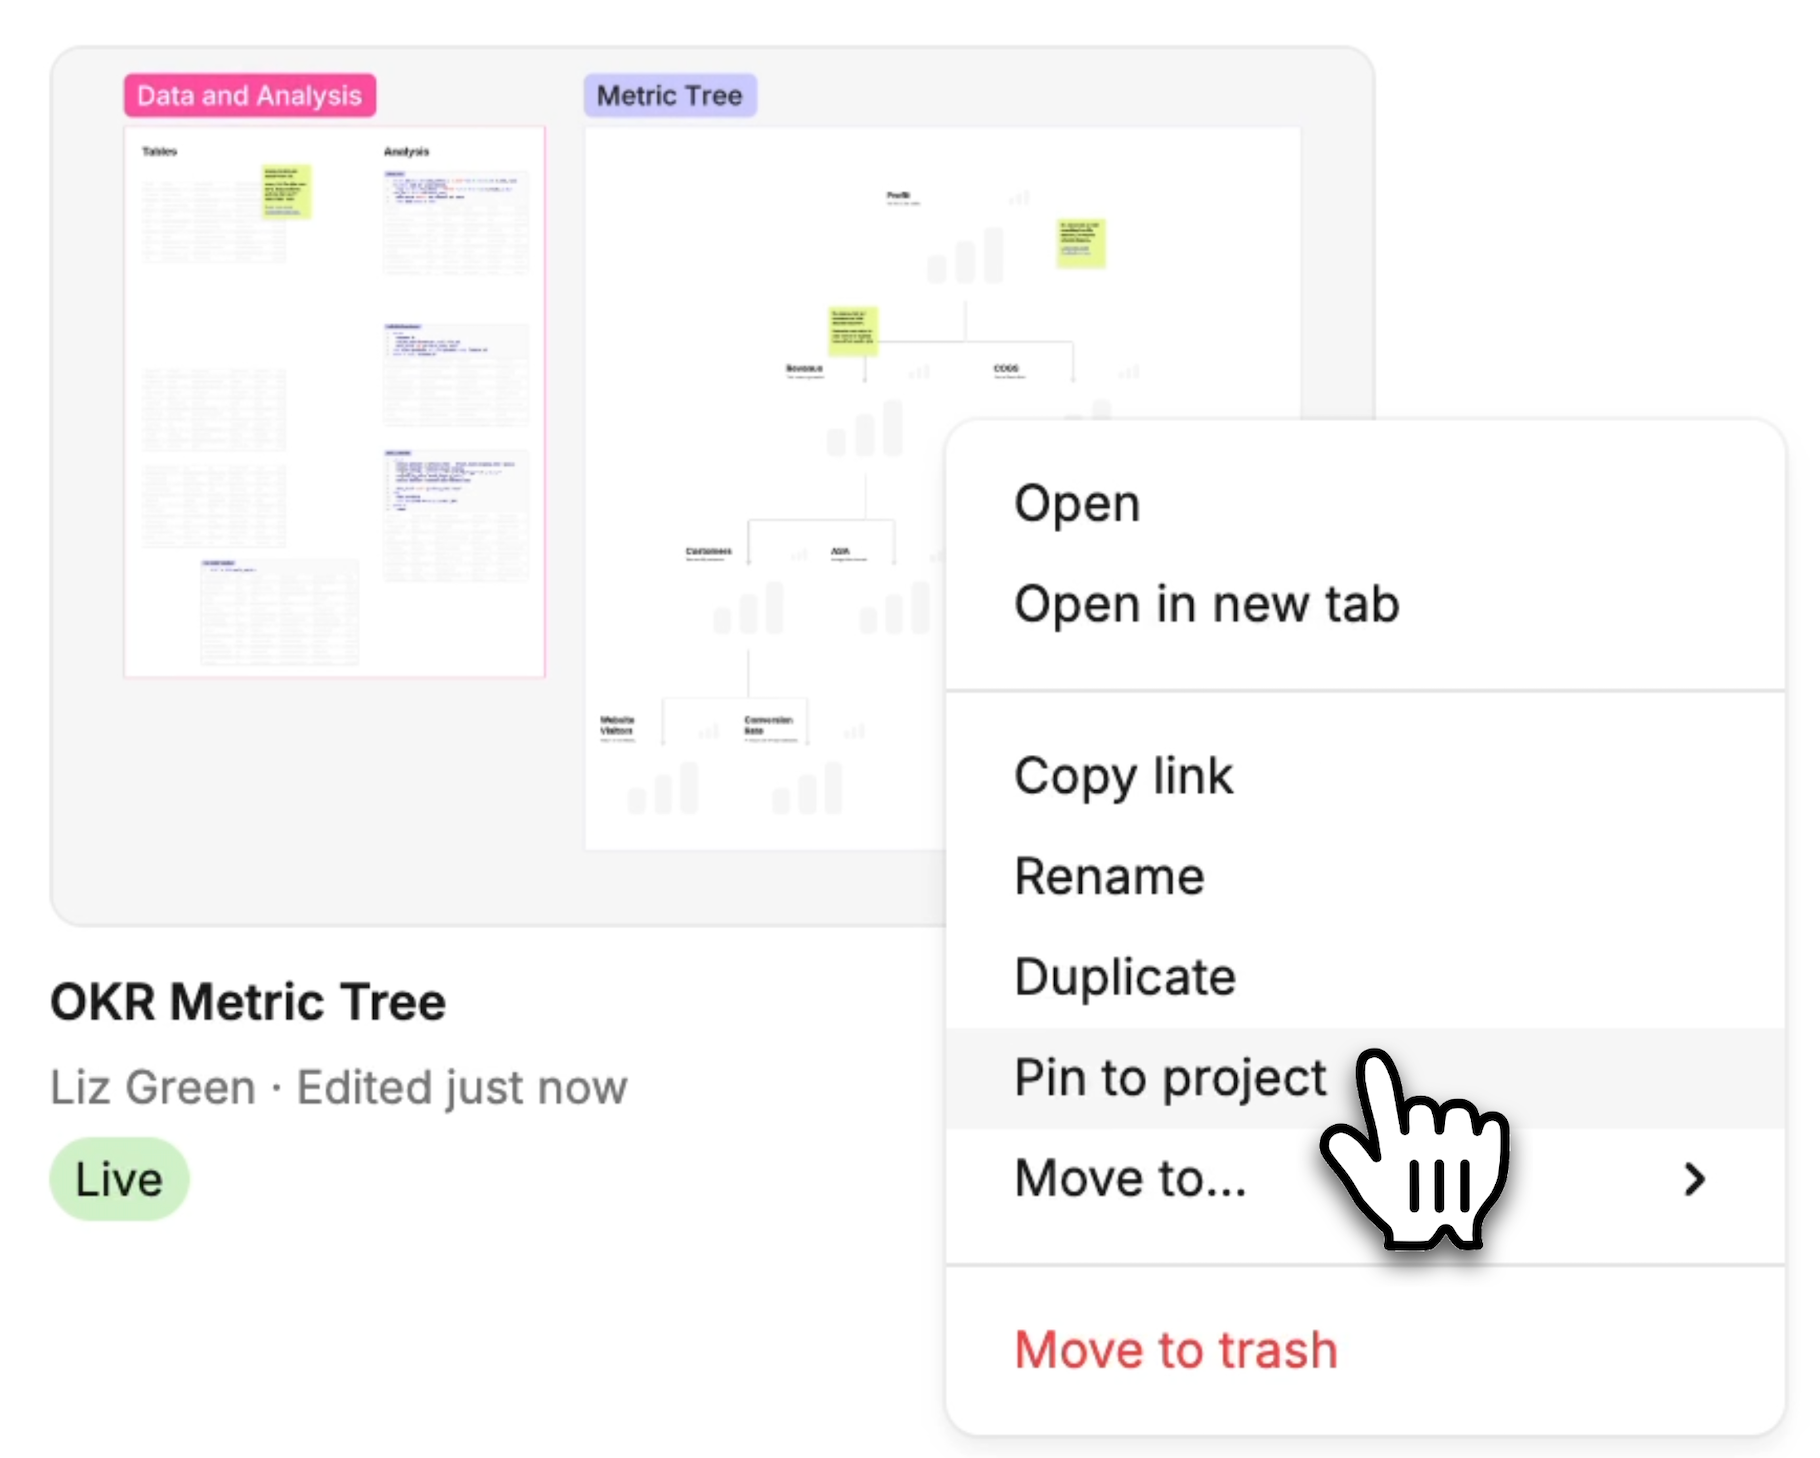
7. Pin your work - pin canvases to surface the most important or frequently accessed canvases, so they don't get lost in busy workspaces.
9. Build templates - templates are great for empowering users to build and develop, whilst maintaining some aesthetic consistency. You could also create Shared Styles so users can brand their canvases with your company colours.
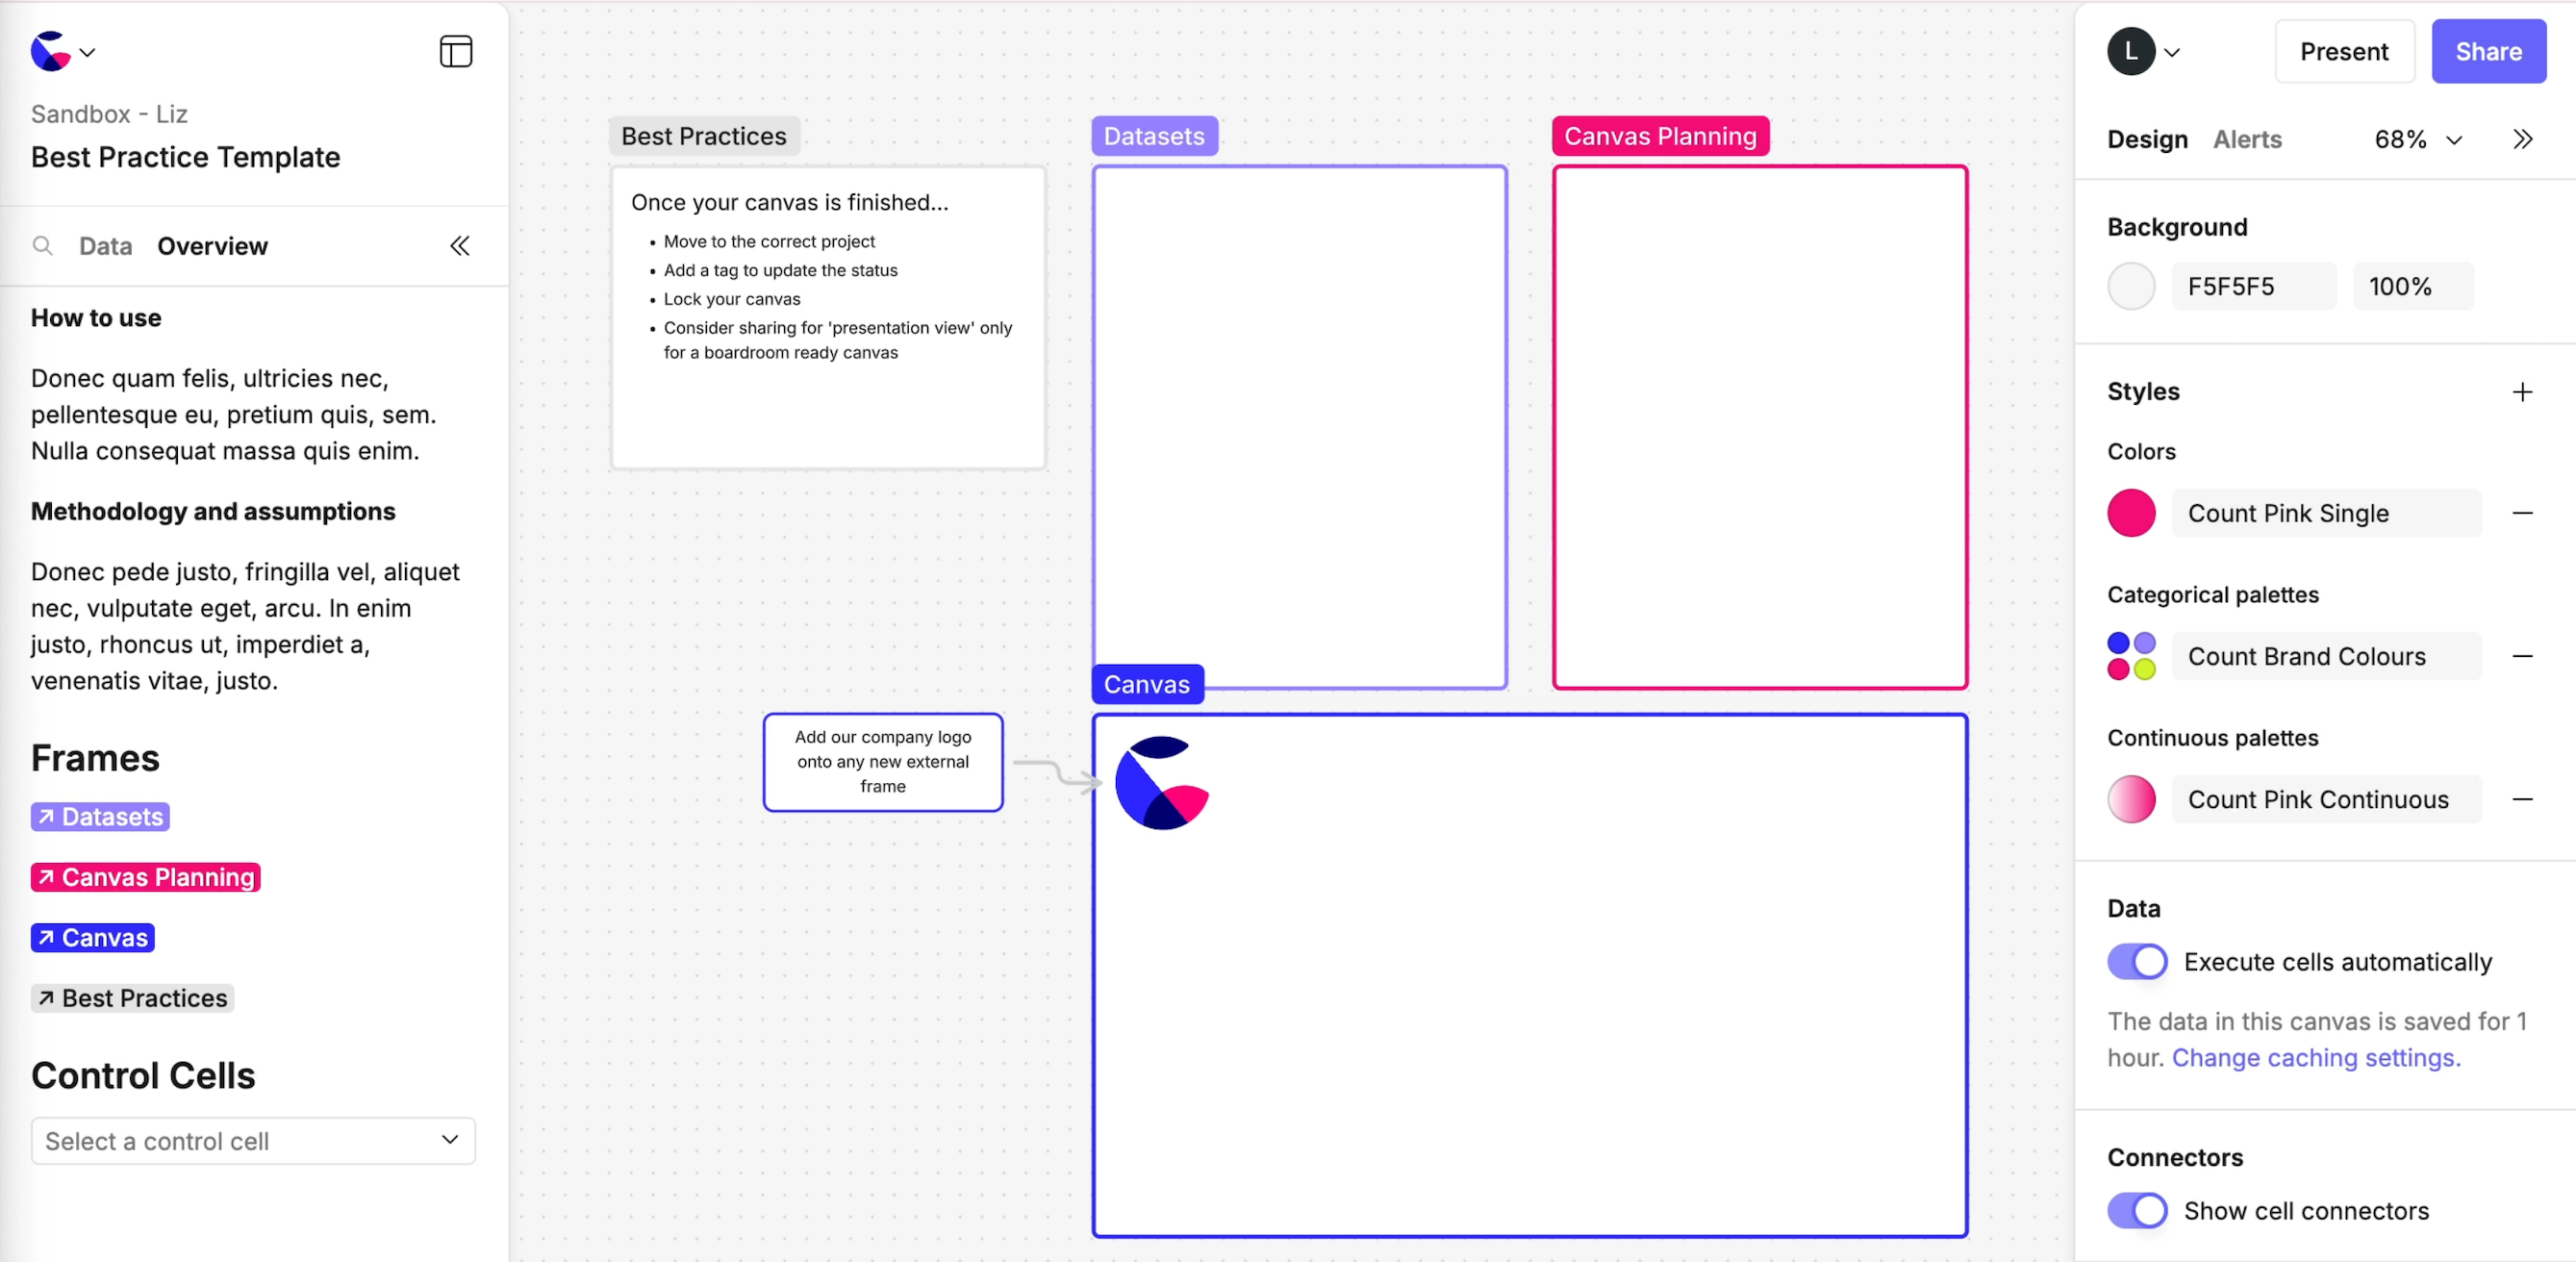
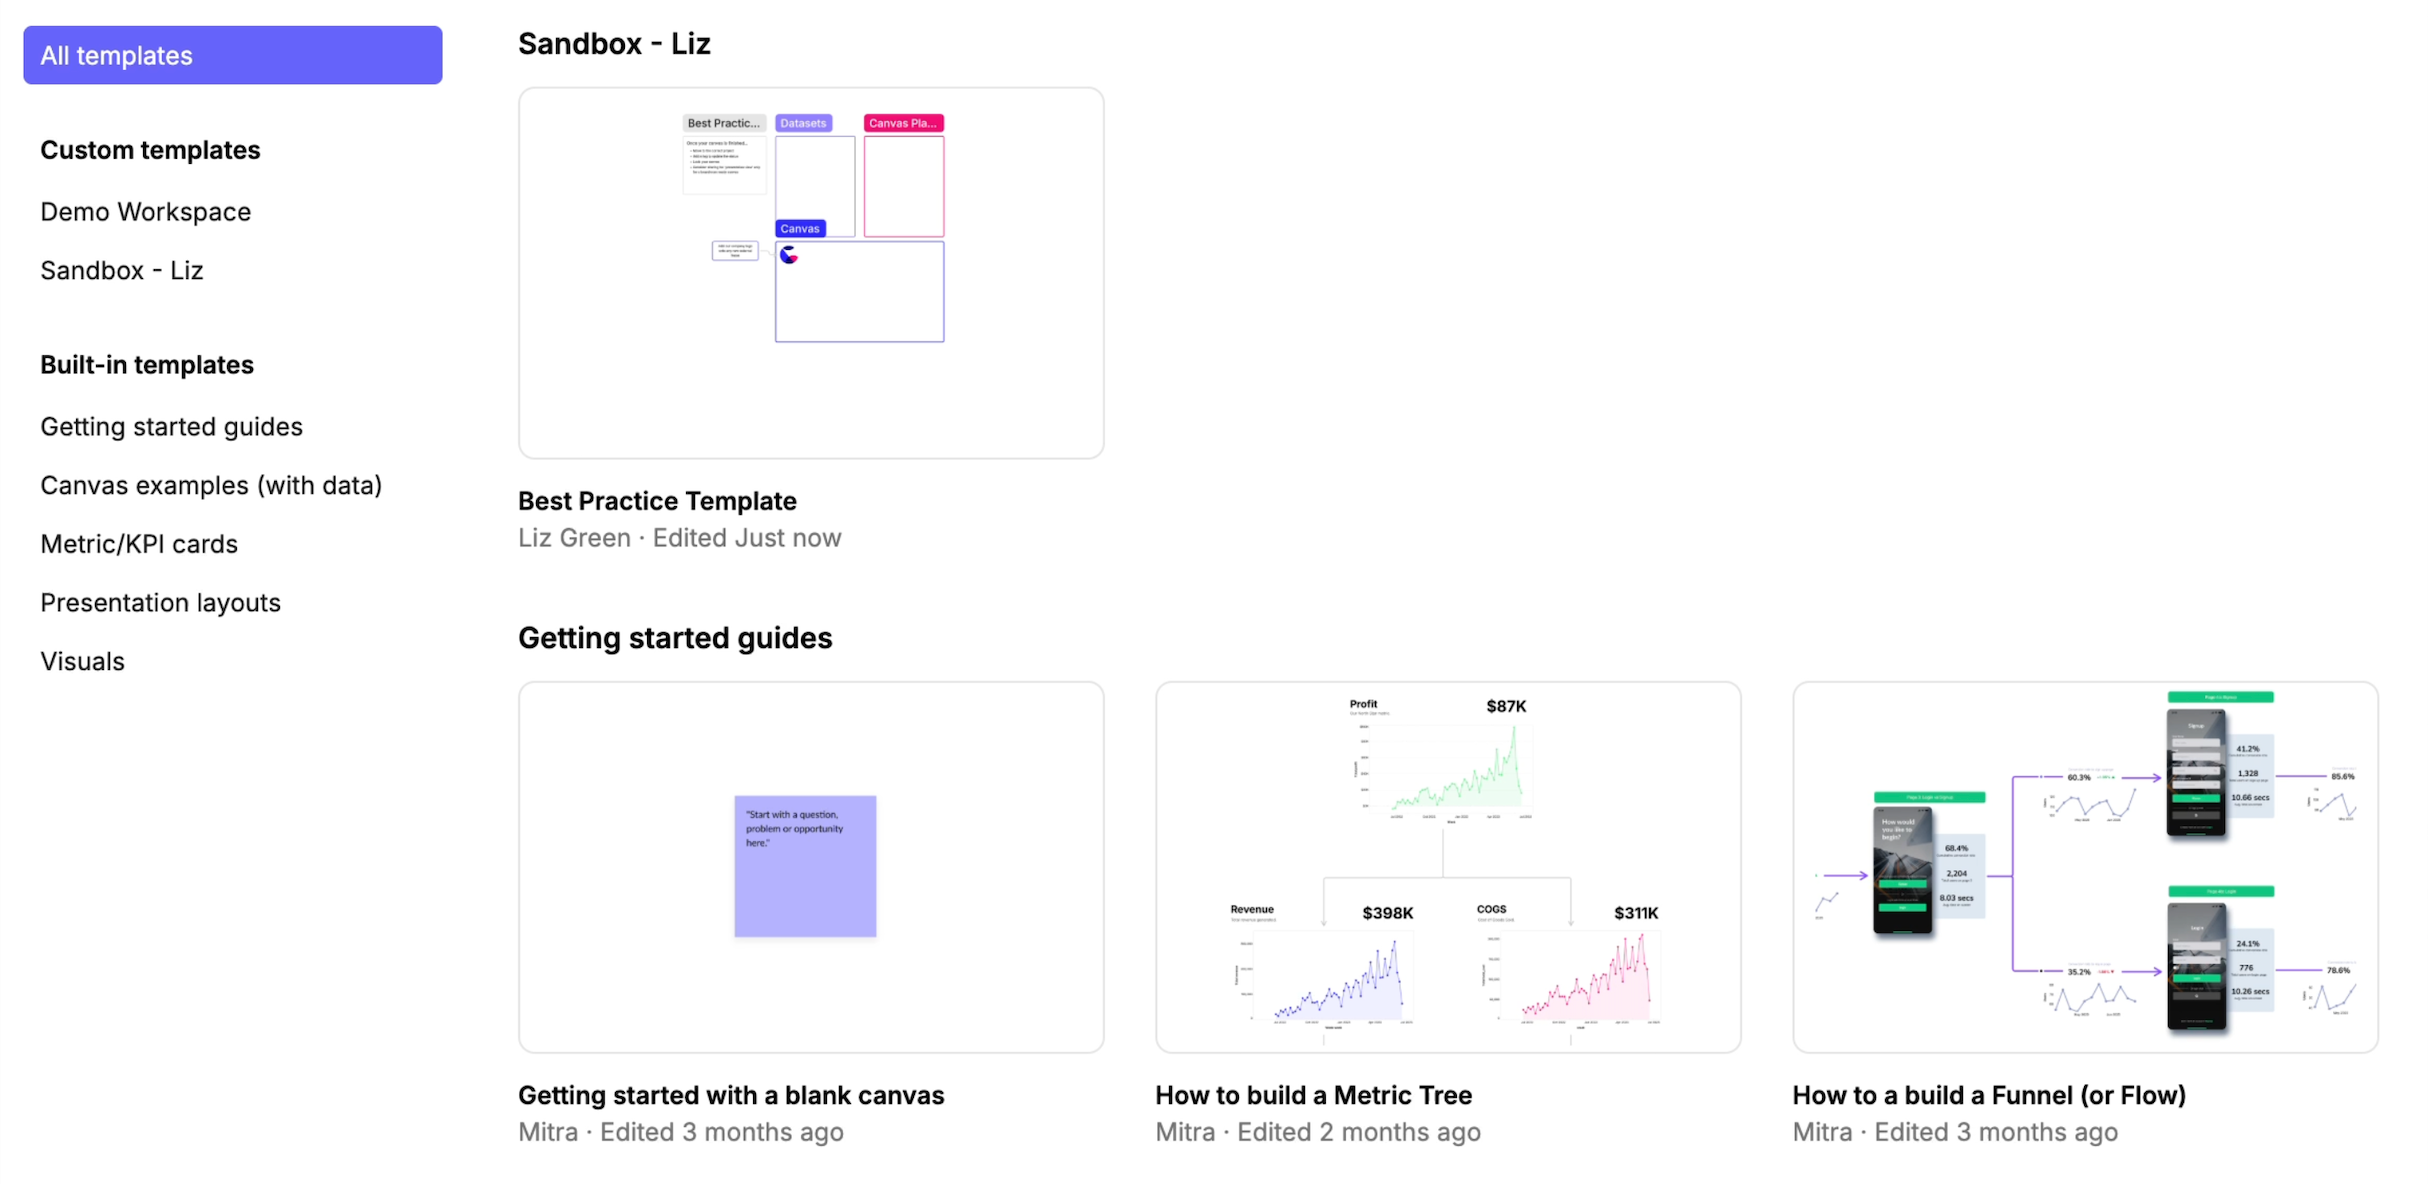
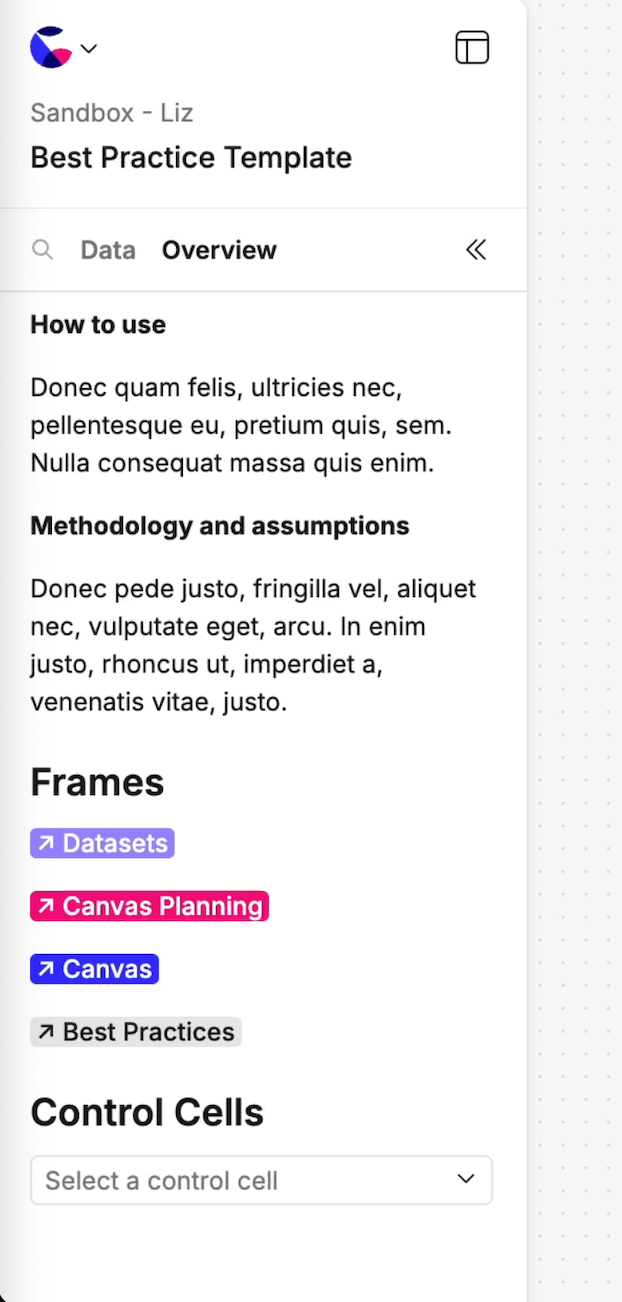
10. Add in an 'Overview' - An overview panel is perfect for summarizing the canvas. Include things like title, purpose, methodology, frame links, filters, and a canvas log. This builds trust, users instantly understand the purpose, method, and who to contact for questions. You could build an outline for one into a template.
Frequently Asked Questions
What data is included in the PDF file?
+−
When exporting a PDF, Count will include everything that is currently visible within the frame. If, for example, a cell has not finished loading yet, then that data will not be included in the PDF.
For tables, depending on the current scroll position of the table there may be columns and rows included in the PDF that are clipped outside the visible region of the table, and so will be included and selectable, but not visible.
Images are embedded into the PDF file, including those generated by Python cells.
Comments are not included in the PDF file.
How can Count help break down silos between data teams and the wider business?
+−
Silos tend to build between data teams and the business when they settle into a pattern of request–fufillment rather than genuine collaboration where both sets of expertise are valued and valuable. Count's realtime collaboration and canvas make it easy for both groups to have an impact on business improvement. For example, domain experts can prototype metric maps, reports, or analysis in the canvas providing a skeleton for analysts to populate, before reviewing and iterating along side. Additionally, data teams can easily see team-generated canvases, and build out standardised templates and semantic definitions in Count Metrics.