Manage Queries And Results
Most of the time when using Count, it isn't necessary to monitor query execution - the appropriate queries will be submitted automatically based on your changes to cells and other canvas objects.
In some cases it may be important to control exactly which queries are executed - for example, if the query is expensive or your database is expected to be under heavy load. Below you can read more about the query lifecycle in Count, and how to control queries and their results.
Query lifecycle
When a query begins executing in a Count cell or visual, the current state of the query is displayed in the output area of the cell:
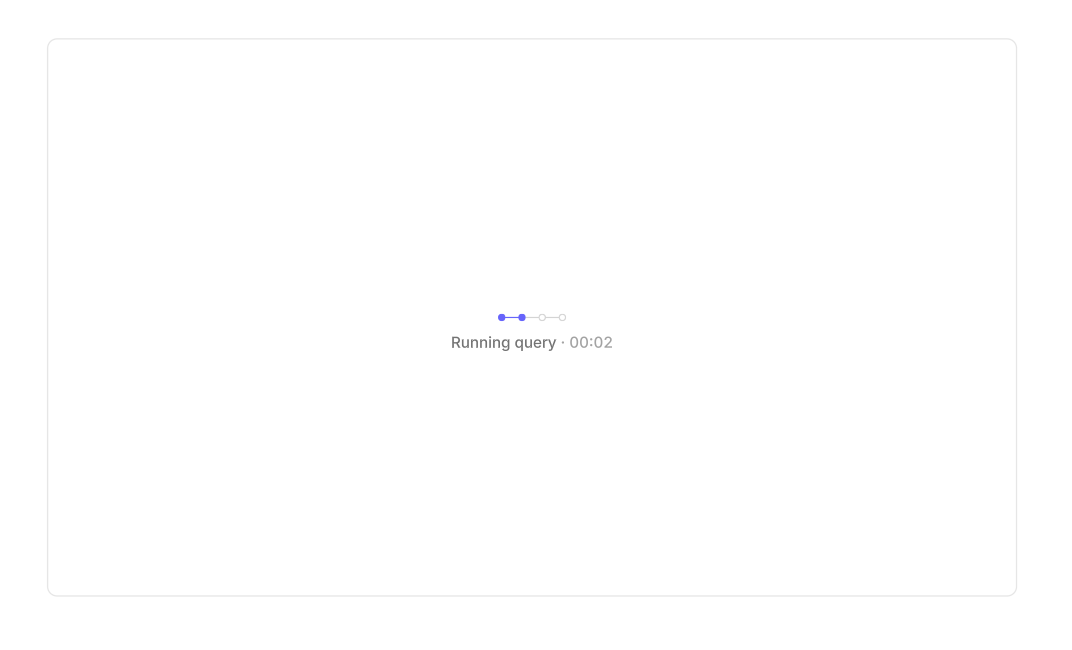
The stages are:
• Connecting - your browser has asked for a query to be submitted. If other queries for the same connection are also waiting to be executed, the number of waiting queries will also be displayed.
• Running query - Count has sent the query to your database, and is waiting for the results. The displayed execution time includes both the time spent running the query, and the time spent retrieving the results.
• Compressing results - Count has received the result set for the query, and is compressing it.
• Downloading results - your browser has been notified that the query results are ready, and has begun downloading them.
Some of these steps may be skipped or display different information in the following cases:
• Connecting - for local DuckDB or Python cells, this step also includes the time spent loading the database or Python instance, and waiting for upstream cells to finish executing.
• Running query - this step may be skipped if cached results are available for the cell.
• Compressing results - this step may be skipped if the query results are small.
Run a new query
When it is important to see the latest data for a cell, it is possible to tell Count to bypass any cache, and send a new SQL query to your database. If caching is enabled, the cached results will be updated at this point.
• Clicking the Run cell button above any selected cells will execute those cells. (Note that choosing this option will also re-enable cell execution if it has been disabled previously).
• Clicking the Re-run all cells button in the cell result table (see below) will re-execute all canvas cells. Please note that this action may result in submitting many queries to your databases.
Prevent query execution
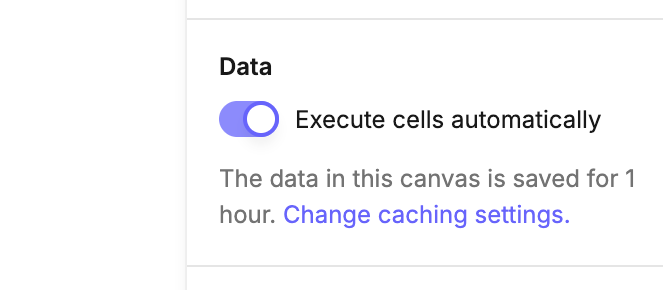
If it is important to reduce load on your database, it is also possible to prevent cells from executing in response to changes:
• Click the Disable cell execution button underneath the Run cell menu to prevent that cell executing automatically in the future.
• Deselect the Execute cells automatically option in the design sidebar to prevent any cell from executing automatically.
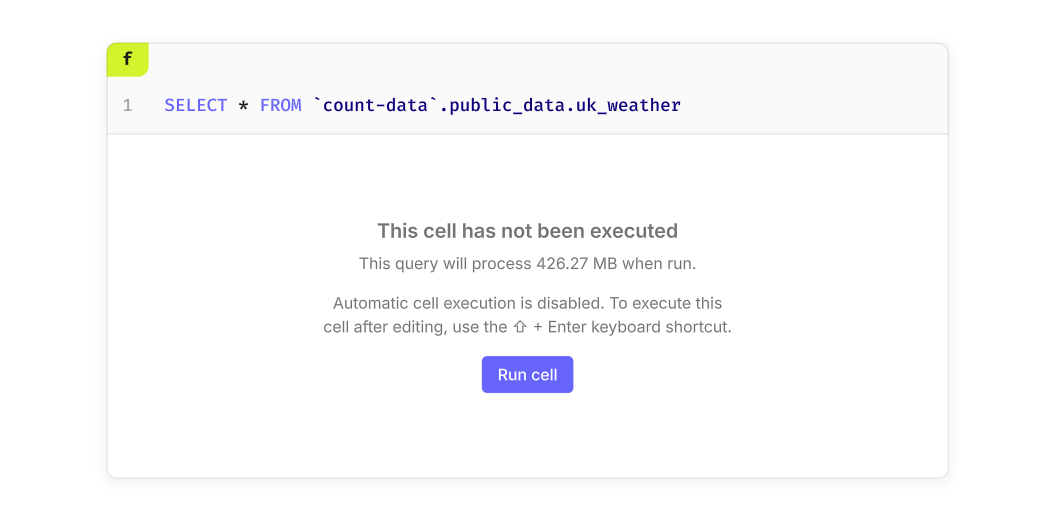
If a cell is prevented from executing automatically, it will show a message with an option to execute the query. If the cell is connected to a BigQuery connection, it will also show an estimate of the amount of data that will be processed by the query:
Cancel running queries
Count supports query cancellation for all database connections. Currently-executing queries can be viewed and cancelled from the settings pages for each connection.
How query cancellation works
The effectiveness of cancelling a query from Count may depend on the database connection used, and in which step the cancellation was requested:
• Connecting - cancelling a query during this step should always succeed, as the query has not started execution yet.
• Running query - cancellation from Count is not always guaranteed for some database types, though the cancellation request is always sent to your database.
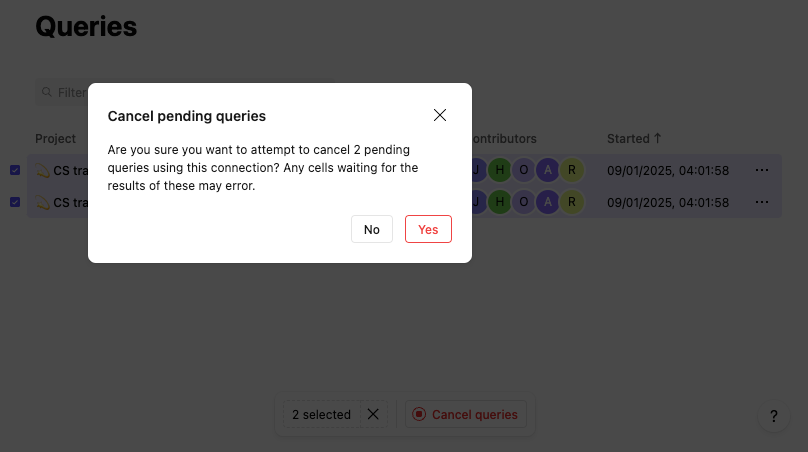
Cancel queries in a canvas
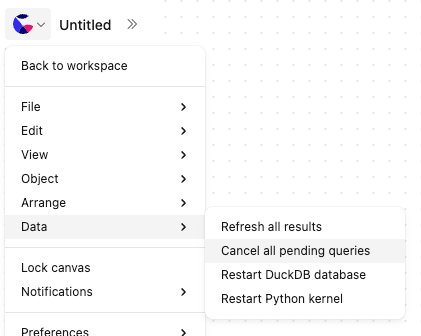
If your role allows you to edit a canvas, the option to cancel all pending canvas queries will be available in the data menu:
Cancel queries for a connection
If your role allows you to edit a database connection, you are able to cancel all queries for that connection:
• From the connection page, select See all from the queries section in the sidebar to view running queries.
• Select one or more queries, then choose Cancel queries and confirm the cancellation
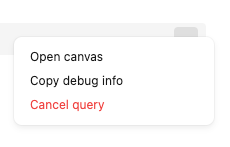
When contacting Count support about a running query, please include the debug information about the query from the context menu:
Manage query results
By default, all cells in Count apply a limit of 10,000 rows in the SQL that is sent to your database to minimise the time spent transferring large result sets. (This limit is not applied to DuckDB cells.)
This default behaviour can be changed from the Row limit settings in the Design sidebar:
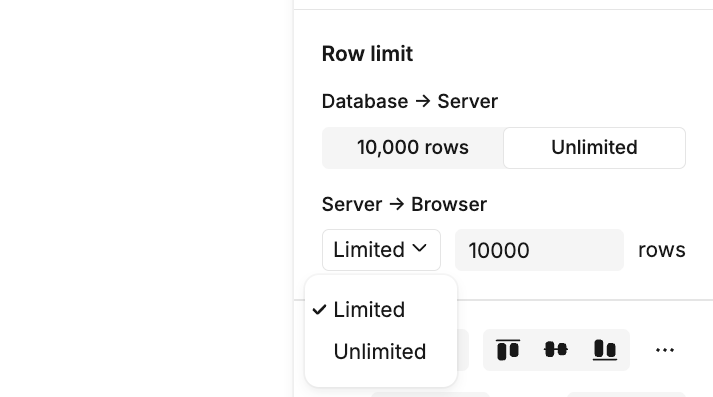
Selecting the Unlimited option will remove the 10,000 row limit from the SQL query, and Count will continue to fetch results until they are complete, or their uncompressed size reaches the limit configured for your workspace - typically at least several hundred megabytes.
Info
It is strongly recommended to enable caching of results if using the Unlimited setting, to avoid frequent re-execution of long-running queries.
• Server -> Browser - set this option to a number to limit the number of rows that are downloaded to your browser. Choosing Unlimited may result in high memory usage, and is typically not recommended unless there is a need to work locally for all downstream cells.
Tip
If caching is disabled for this canvas, then all results are always downloaded regardless of this setting.
Canvas cell results
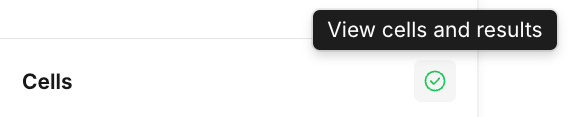
To see the currently-available query results for all cells in the canvas, click the status icon next to the cells pane in the data sidebar:
This icon shows:
- A green checkmark - no issues were detected with your query results
- A warning triangle - if any of your cell results have expired, or are causing high memory usage.
After clicking, the cell result table is opened:
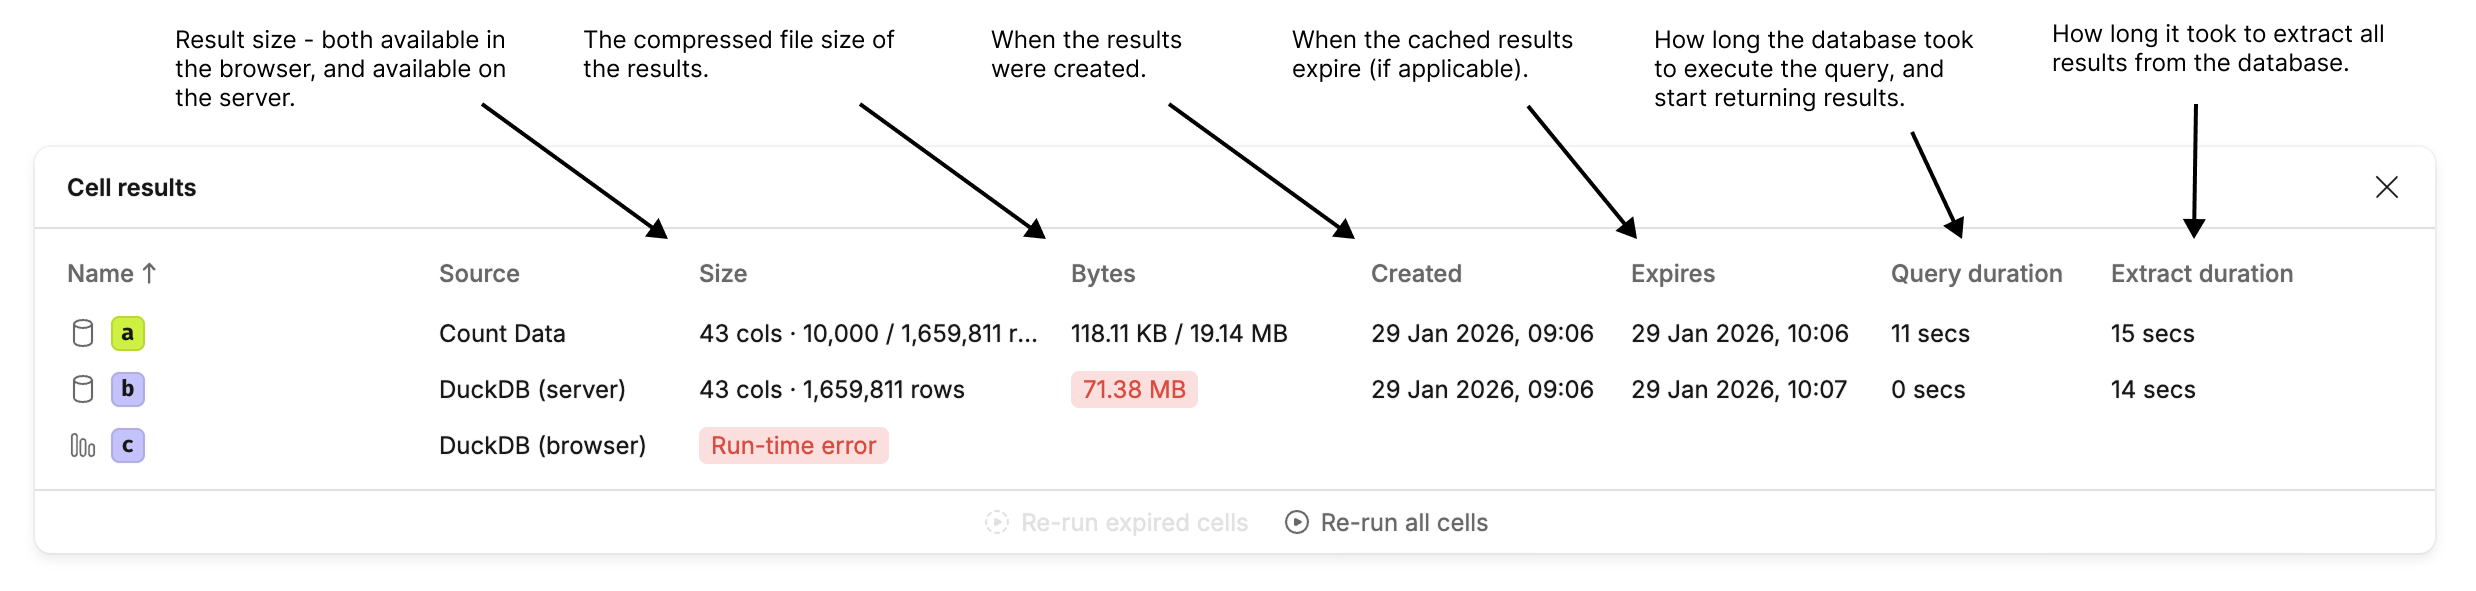
This table shows:
- Name - the name of the cell, and name of the visual mark (if the visual has results from multiple marks).
- Source - the data source that the results were derived from.
- Size - the number of rows and columns in the result set. If a row download limit has been applied, this column shows both the number of rows available in the browser, and the number downloaded to Count's servers. If the query failed to execute, clicking the error will display the error message.
- Bytes - the size of the uncompressed results that were extracted from the database in binary format. If a row download limit has been applied, this column shows both the size of file downloaded to the browser, and the size of the file on Count's servers. If the memory usage of these results is high (above 100MB), the size is highlighted in red. The memory usage of a result set may be much larger than the file size, once the results are loaded into memory.
- Created - when these results were created - typically when Count finished extracting all of the results from the data source.
- Expires - when the results are scheduled to be removed from Count's servers. Once results have expired, they can no longer be referenced by DuckDB on the server, so in this case any downstream DuckDB cells will begin to run in the browser. If results have expired, the expiration time is highlighted in red.
- Query duration - how long the query took to execute.
- Extract duration - how long it took to extract the results from the data source. In some cases this duration is included in the query duration, and so is not shown.
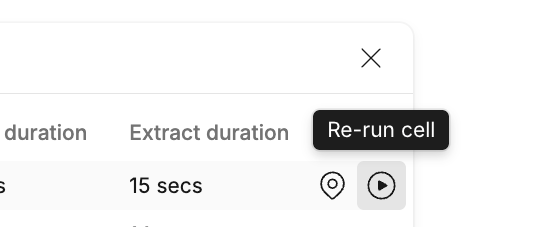
Hovering over any table row presents options to navigate to the cell, or re-run the cell:
Profile DuckDB performance
If you find your DuckDB cells are running slowly, and the duration listed in the footer of the cell is high, you can profile the cell to pinpoint performance issues.
Select Profile query performance from the sidebar, and a new query will be executed for that cell with performance tracing enabled:
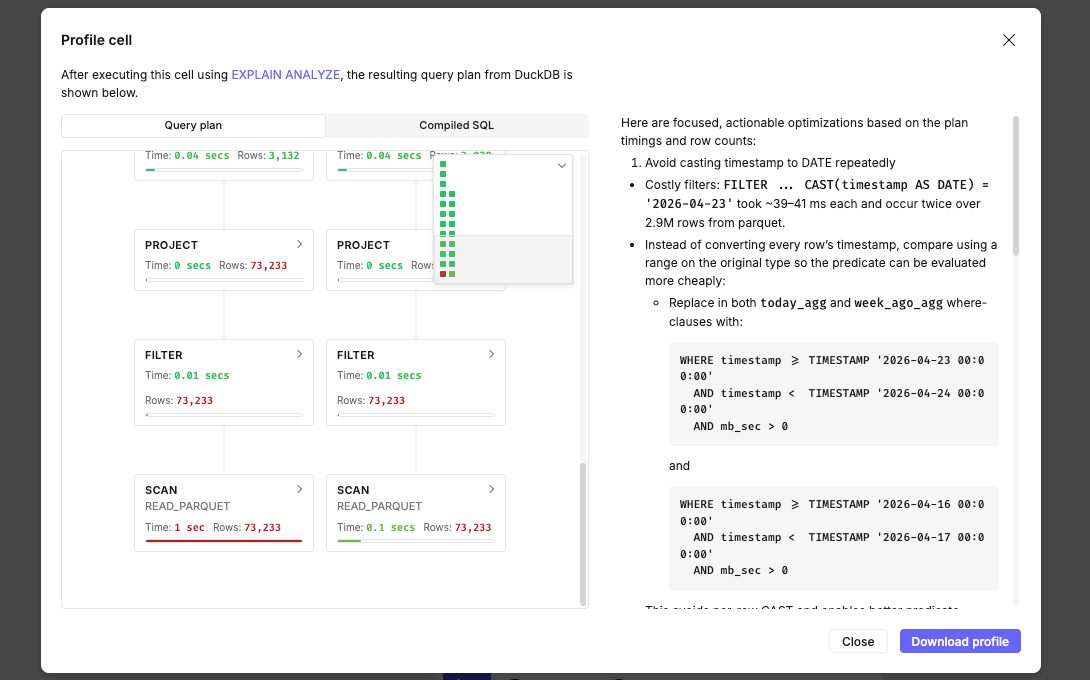
In this view you'll see:
- Query plan - the steps taken by DuckDB to execute your query, from inputs at the bottom to outputs at the top. Long-running steps or large step results are highlighted in orange and red colours.
- Compiled SQL - the SQL that was actually executed by DuckDB. It includes any upstream cells that were compiled into the query, and any compiled Jinja expressions.
- Performance suggestions - if AI is enabled for your workspace, on the right you'll see some automated suggestions for improving query performance based on the query plan and executed SQL.
- Download profile - download the query plan in JSON format to explore yourself, or in third-party tools - for example, this open source DuckDB query plan viewer.