Control Cells
Control cells make your reports interactive by allowing users to filter data directly on the Count canvas. They dynamically update downstream visualisations and tables.
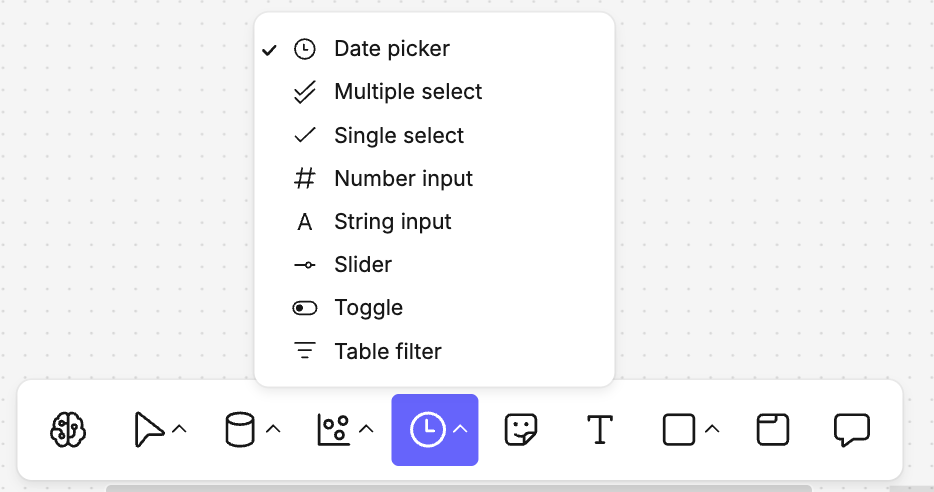
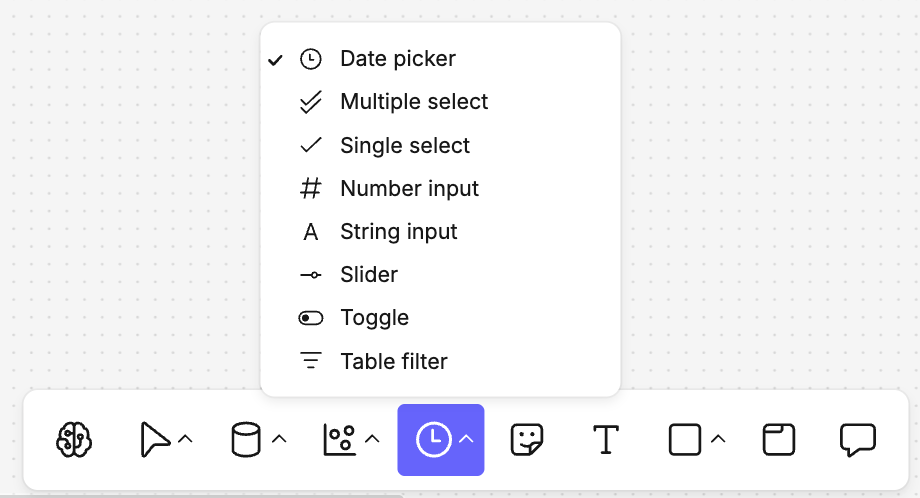
You can choose from the following types of interactive controls cells:
- Number input - accepts number input. Can be used with condition options such as greater than, less than etc
- Toggle input - an on/off field that accepts only boolean data
- String input - a free-form text entry field
- Single select - a drop-down to allow selection of a single element of a column (max 1,000 results)
- Multiple select - a drop-down to allow selection of multiple elements from a column (max 1,000 results).
- Slider input - a slider input to select a specific value. Can be used with condition options such as greater than, less than etc. Min and max values are configured in the design bar that appears on the right when the control cell is selected.
- Date picker - a date selection cell to either an exact or relative time.
- Table filter - a cell that directly presents all fields in a table (as selected in the right-hand design bar) with a built in mechanism for adding a filter.
How to add a control cell to a canvas
A control cell is added to your canvas by selecting it from the toolbar at the bottom of the screen
How can I connect a control cell to a visualisation?
We have 3 methods for setup, based on different use cases:
- I would like ALL visualisations & tables downstream to be filtered
- I would like to select SPECIFIC downstream visualisations & tables to be filtered
- I would like to embed a filter in a sql query
1. Filter ALL downstream cells
Example use case: in a traditional dashboard, we might want to filter all the visualisations that appear by a field called country_code.
- We add a control cell to the canvas by selecting control cell from the bottom toolbar.
- We select the type of control cell and where to put it on the canvas. When we click on the control cell, a side bar appears. We give it a meaningful name (see 1 in Control cell sidebar image below).
- In the next section down in this sidebar, where it says Cell/table select the table or view containing the source data for the visualisations and just below, the name of the field you want to use as a filter (see 2 in Control cell sidebar image below).
- In the sidebar, under Automatic references, we select all the source data tables that should be referred to by this filter, including the one we already added in the previous step. Additional source tables are included by using the + symbol. For each source table (automatic reference) added, ensure we select both the source table and the field (constraint), clicking the 3 dots next to it (3 in Control cell sidebar image below).
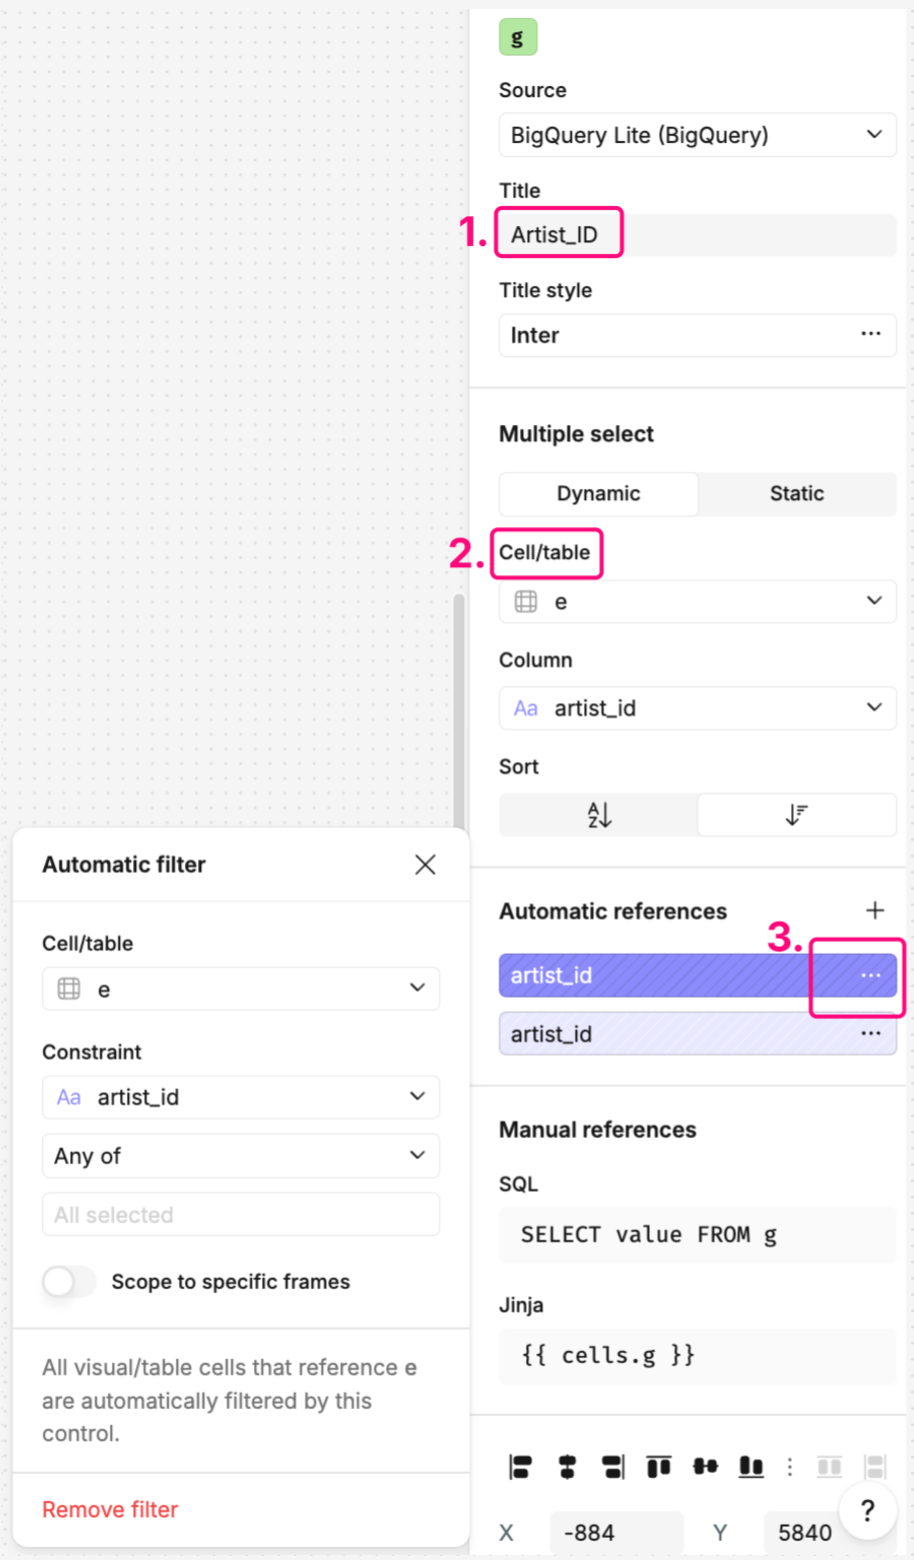
We do not need to specify the target cells as all downstream cells from the source tables will be affected by this filter. If we want to limit this within the canvas, we can do so by grouping the visual cells that should have the filter applied into frames and selecting the toggle to scope to a specific frame, available in the menu related to each automatic reference (3 above).
2. Filter some, but not all downstream cells
Example use case: when you want to filter specific visualisations (e.g. regional sales charts) while keeping others, like national KPIs, unchanged.
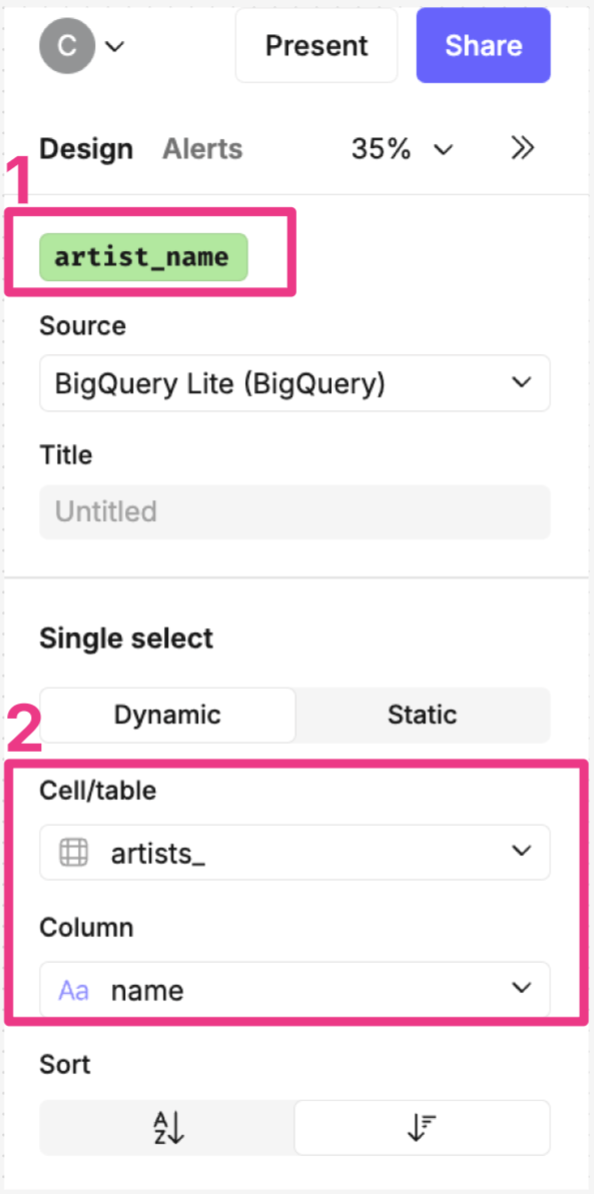
- We add a control cell to the canvas by selecting control cell from the bottom toolbar. When we select the control cell on the canvas, the side bar appears on the right. We give the control cell a meaningful name (1 in control cell sidebar image below).
- In the next section down in this sidebar, select the name and field from the table or view that contains the source data (2 in control cell sidebar) of our visualisation.
- We click back onto the visualisation we want to filter. In the design sidebar, we drag the field that we would like to filter the visualisation on onto the filters section (see 1 below).
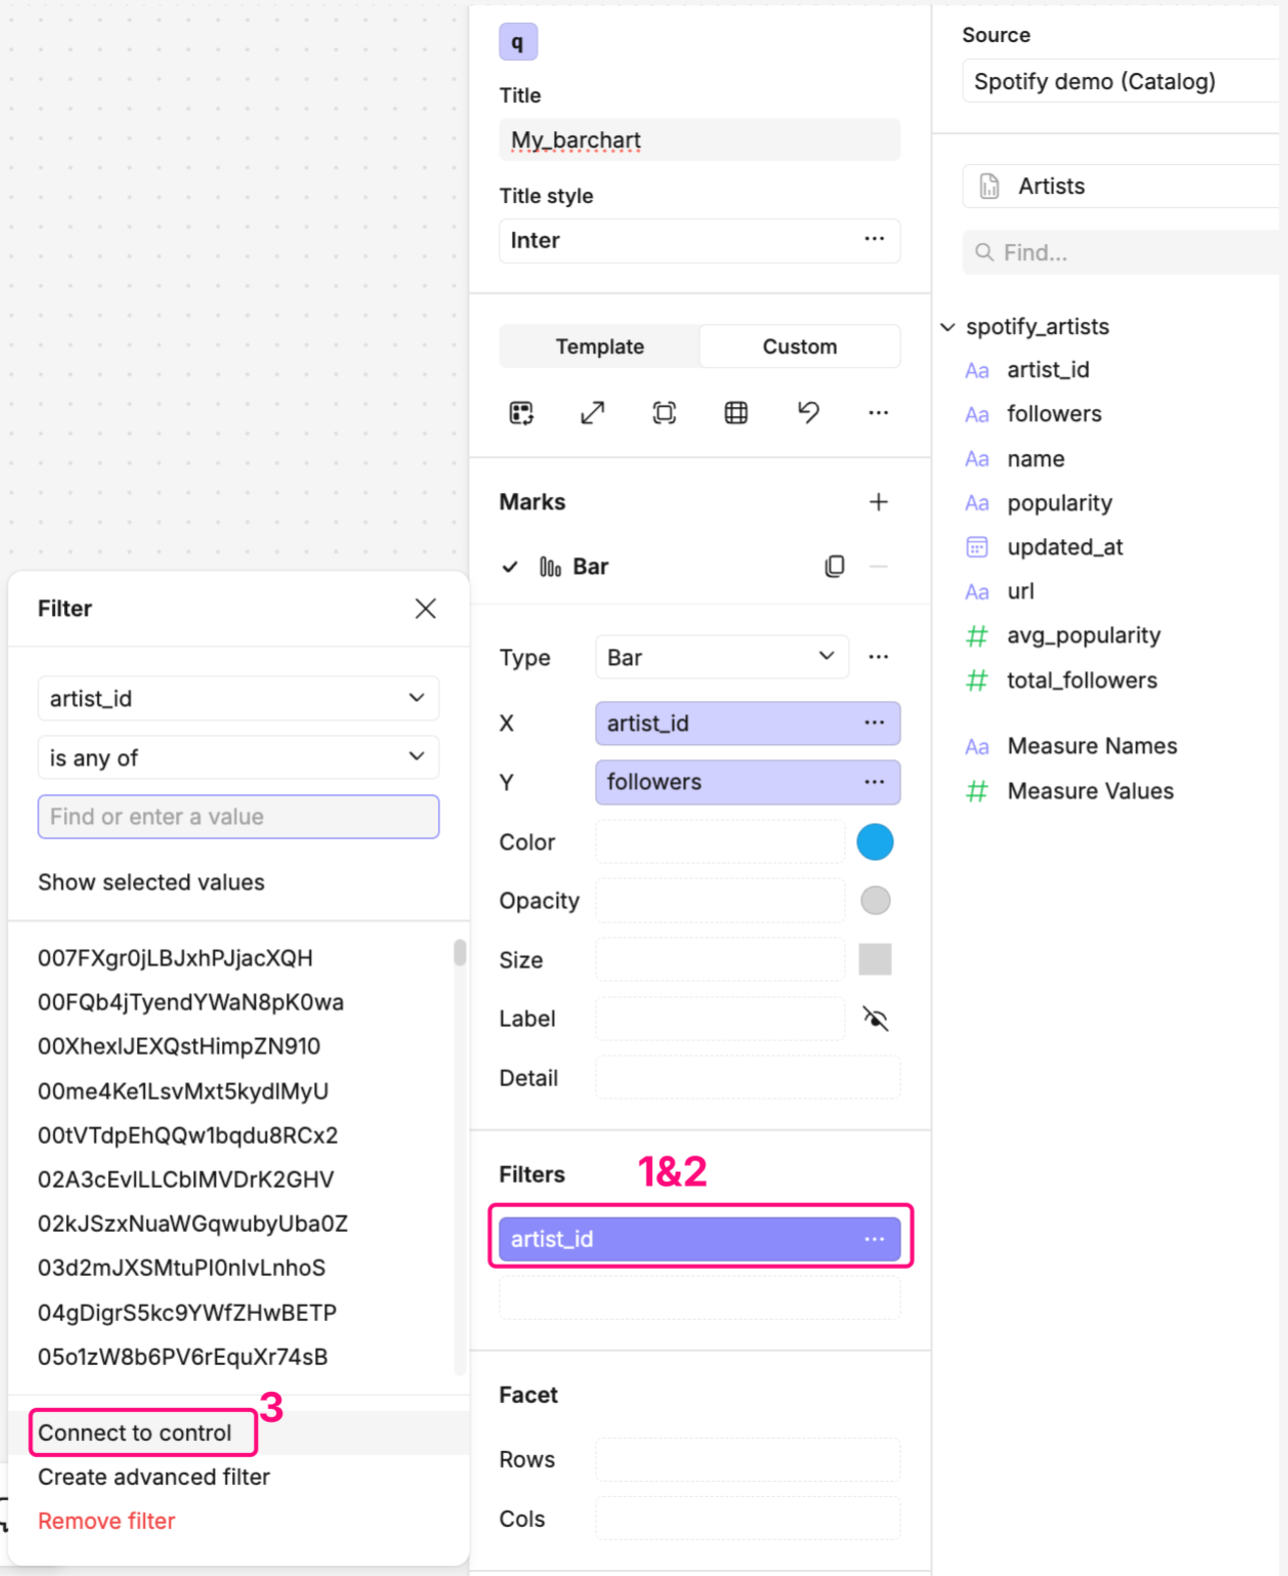
- Click the 3 dots next to the field name on filters (see 2 in design sidebar image above) and a menu pops up. Towards the bottom, we click on “Connect to control” (see 3 in image above) and select the letter name of the control. We have now connected this control cell to this visualisation.
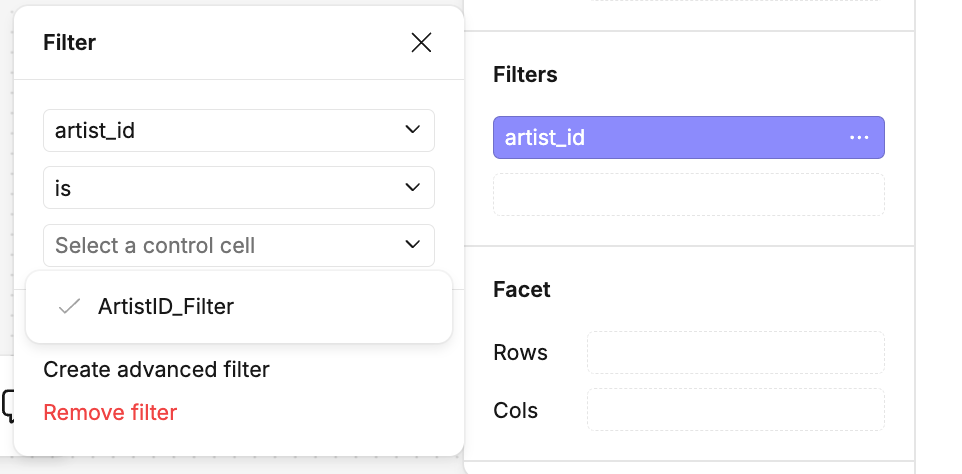
Other visualisation cells can be connected to that control cell in the same way, by adding the field to the filters section in the visualisation's design sidebar and following the steps to connect to a specific control.
3. Embed a filter in a sql cell
We add a control cell to the canvas from the bottom toolbar as we have done before.
We connect it to a sql cell by writing a query that references the control cell.
To help you write your query, click on the control cell to see the manual references that are automatically generated in the sidebar.
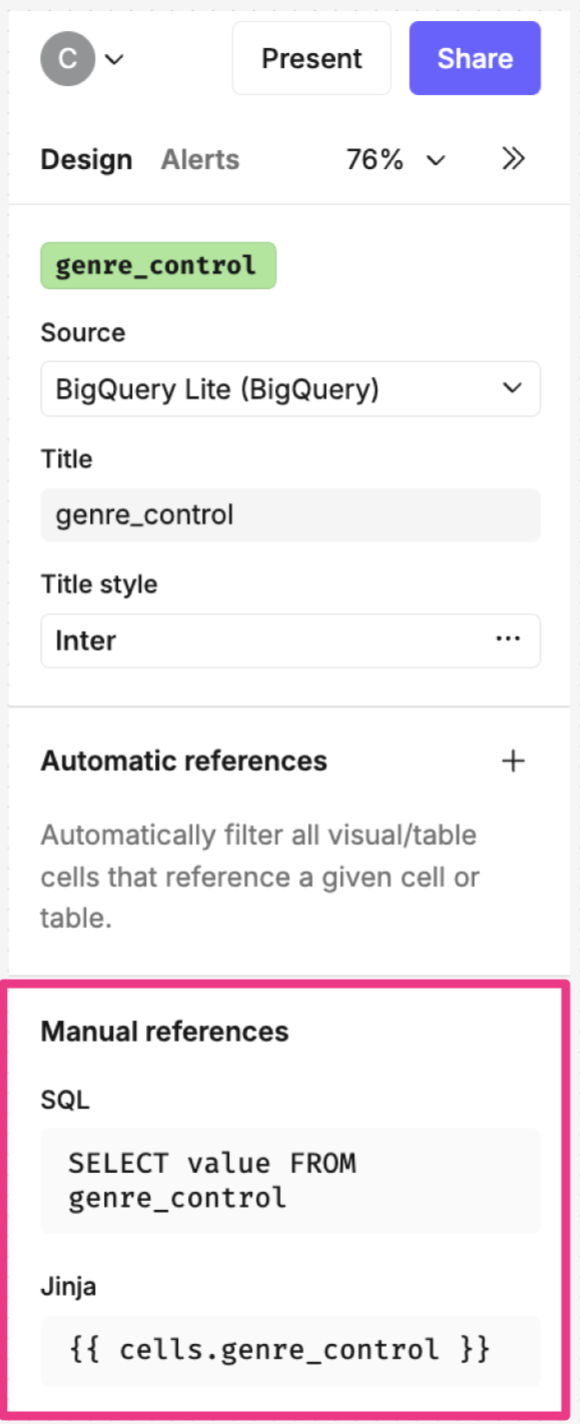
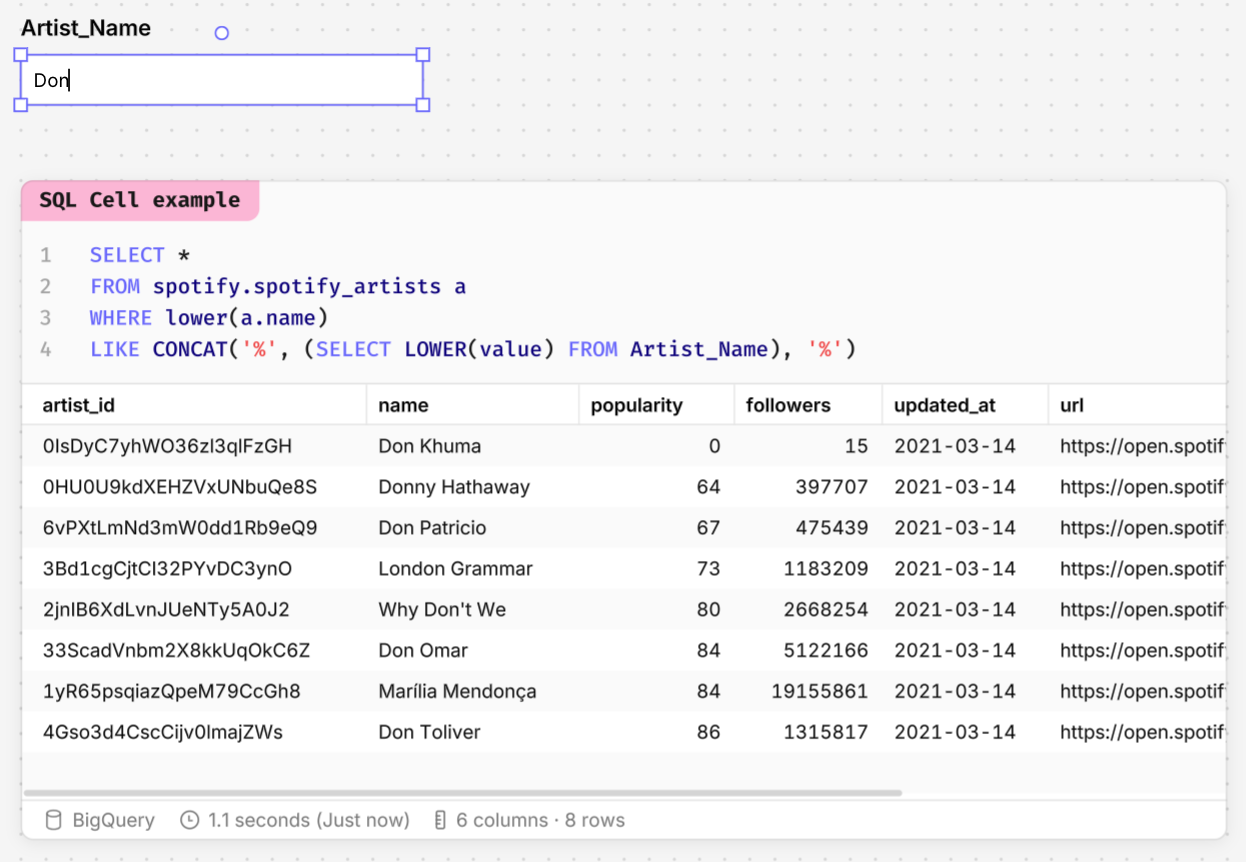
In the example below, the control cell is called Artist_Name and is referenced in the where clause in the query. The syntax may vary depending on the database you are querying. In the example below, the query has been written for BigQuery.
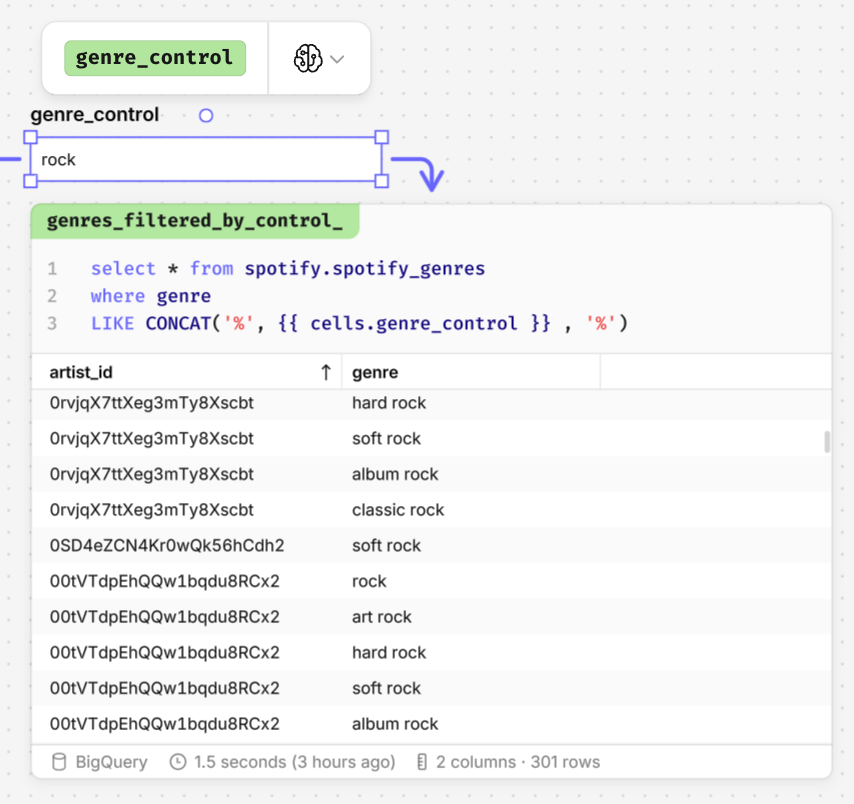
You can either refer to control cells using pure SQL, or using Jinja templates. Below, a cell called genre control is referenced with a Jinja template.
Users of Redshift may encounter errors when referencing control cells using SQL.
Access control cells quickly
You might have added multiple control cells across your canvas, making it difficult to pinpoint where they are in order to filter your data.
In the Overview pane in your canvas, you can add your controls here to make them accessible wherever you or others are in the canvas - even in Report view.
Overview pane -> Type '/' -> Select the control you want to add
You could also add plain text into the Overview for additional context for the control cells.
Allow users to interact with control cells
Control cells will behave differently depending on whether a user has edit or view access to a canvas, and whether the canvas is locked or unlocked.
The table below summarizes how these two states interact:
| 🔐 / Access | Canvas Editor | Canvas Viewer |
|---|---|---|
| Unlocked Canvas | ✅ Can edit control cells | ❌ Cannot edit control cells |
| 👁 Edits are visible to everyone | 👁 Can see edits to control cells made by editors | |
| Locked Canvas | ✅ Can edit control cells | ✅ Can edit control cells |
| 🙈 Can only see their own edits | 🙈 Can only see their own edits |
In summary, if you want a canvas to act like a typical dashboard or notebook where many users are using filters independently then make sure you lock the canvas, but if you intend to use the canvas as a collaborative space, then keep the canvas unlocked and invite contributors to be editors.
Tips
1. Make use of DuckDB
Your Count canvas can query data from different sources:
- A data warehouse, such as BigQuery, that allows cells to query tables within that database and other cells connected to it.
- Local DuckDB, which allows cells to query the results of any other cell on the canvas, as well as uploaded CSV files.
Control cells can only be attached to sources of the same type (e.g., you can connect a control cell to two DuckDB sources, but not to a DuckDB source and a BigQuery source). It’s best practice to first transfer data from your data warehouse queries into local DuckDB cells to ensure you can always connect a single control cell to all data on the canvas, regardless of the source.
2. Check for compatibility
Control cells only function when attached to columns with compatible data types. For example:
- A number input control cell should only be attached to a numeric column.
- A toggle control cell should only be attached to a boolean-type column.