Table Calculations
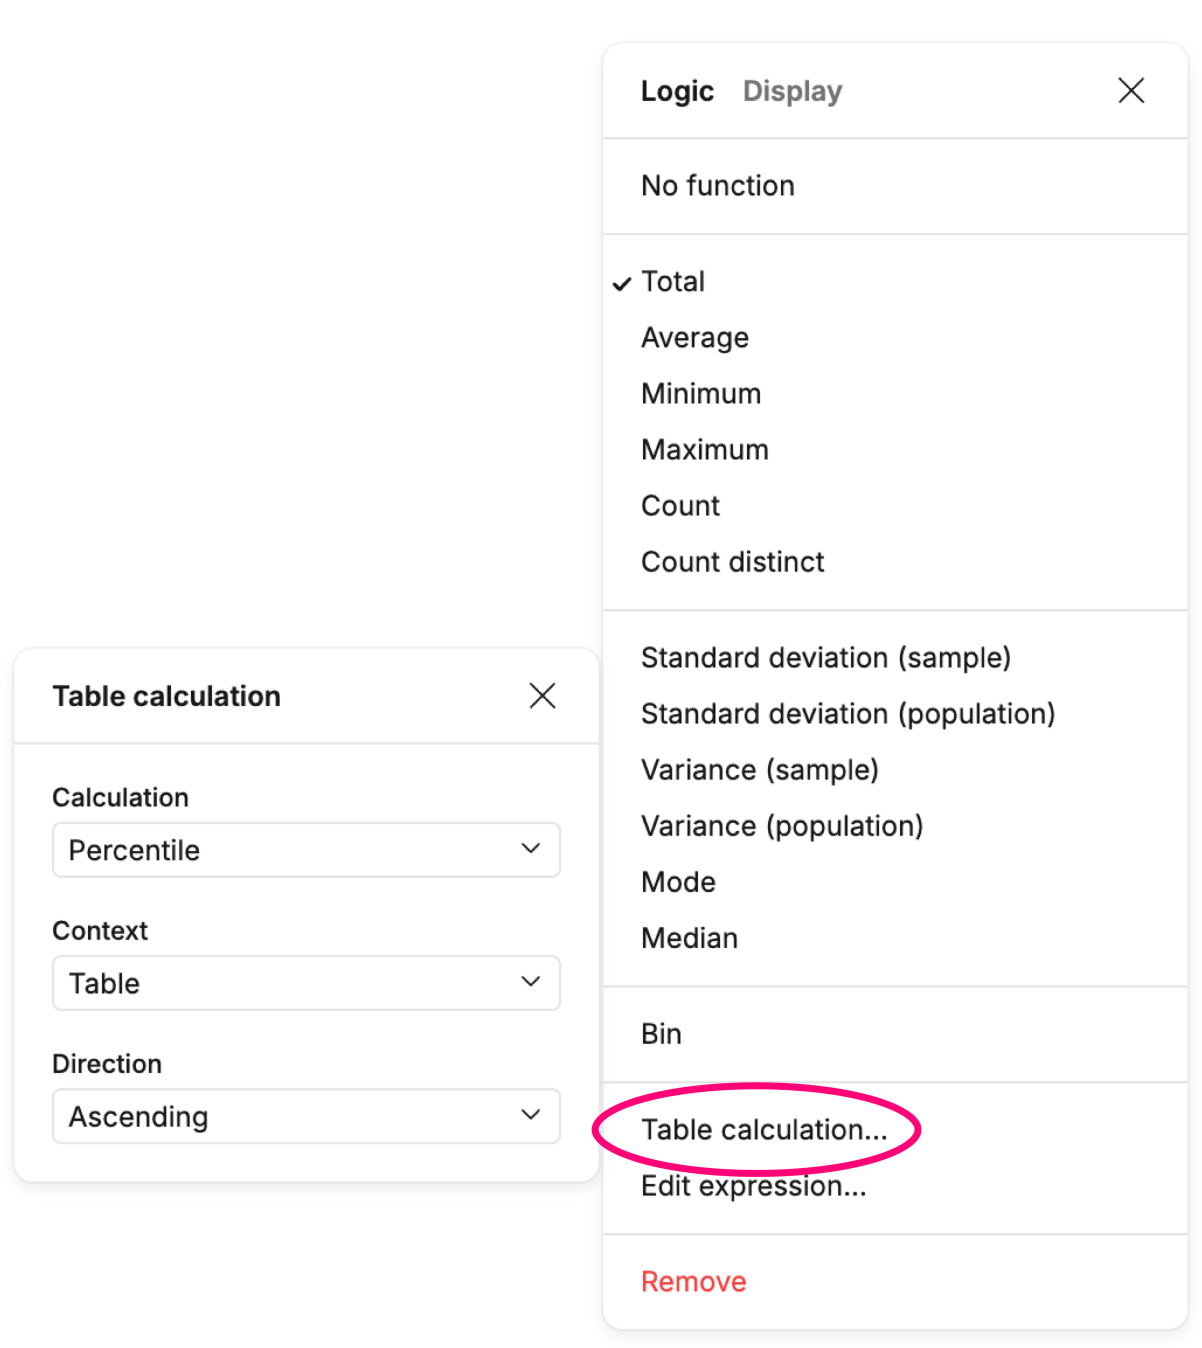
Table calculations are a special type of transformation available in the Logic tab. They calculate values relative to the table, pane, or cell after data has already been aggregated in your visual.
#Calculation types
Currently, the following calculations are supported:
1. Percent of total – Express each value as a percentage of the total, based on the chosen context.
2. Percentile – Assigns each value its percentile rank within the chosen context.
3. Rank – Assigns each value its rank (1 = lowest/highest depending on sort direction) within the chosen context.
#Context options
The Context setting defines the scope over which the calculation runs:
1. Table – Uses the entire table (all rows and columns together).
2. Table (down) – Runs down each column. Each column is calculated independently.
3. Table (across) – Runs across each row. Each row is calculated independently.
4. Pane – Uses only the current pane (for visualizations with facets, each pane is calculated independently).
5. Pane (down) – Like Table (down), but scoped only to the current pane.
6. Pane (across) – Like Table (across), but scoped only to the current pane.
7. Cell – Uses only the value of the individual cell (for Percent of total this is always 100%).
#Direction options
For Percentile and Rank, you can also choose a Direction:
• Ascending – Smallest value = lowest rank/percentile.
• Descending – Largest value = lowest rank/percentile.
Last updated: 31/07/26