Display options
When you add a column to a visual, you can configure it in two ways: Logic and Display. These options are available from the ellipses (...) menu next to the column name in the design bar.
- Logic – Controls how the column is calculated or aggregated.
- Display – Controls how the result is formatted and shown in the visual.
The options available in the Display tab depend on the type of data (Numeric, Date, or Text).
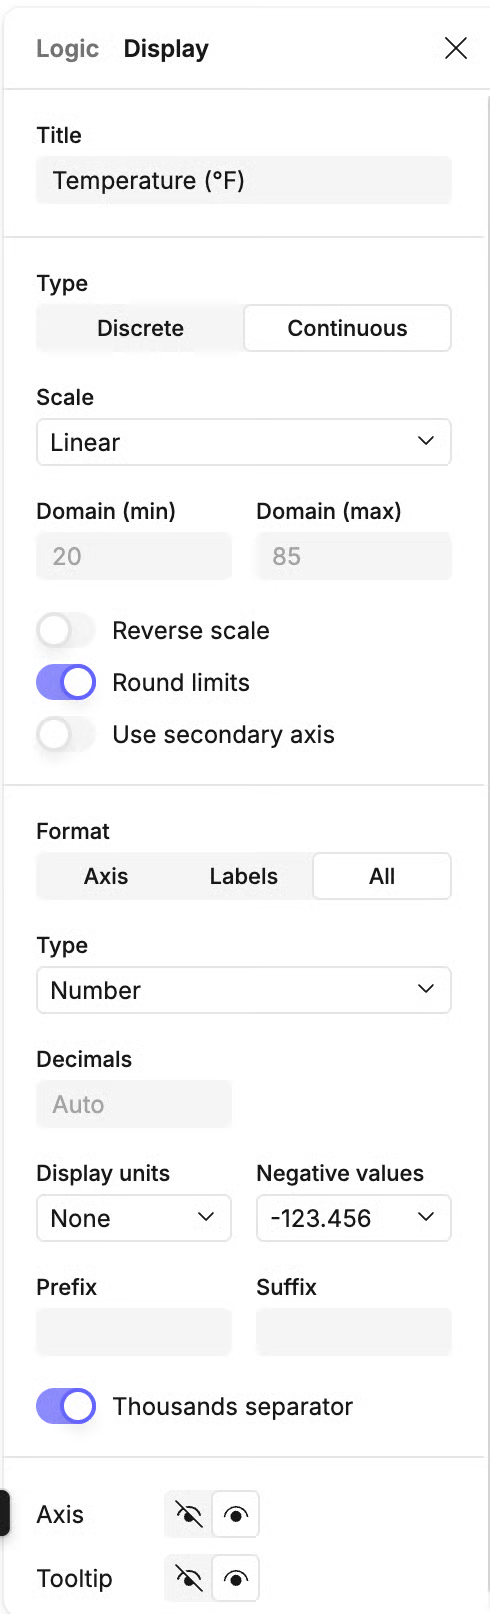
#Numeric fields
When the field contains numeric values:
- Title
Add a custom axis or label title. - Type
- Discrete – treat values as categories.
- Continuous – treat values as a range.
- Sort (Discrete only)
- Natural – numerical order from smallest to largest.
- Alphabetic – A → Z.
- Column – sort by another column’s values.
- Manual – drag and drop to reorder.
- Scale (Continuous only) Choose how values are scaled:
- Linear – evenly spaced values.
- Logarithmic – compress large ranges using a logarithmic scale.
- Base: set the log base (default 10).
- Power – apply an exponential scale.
- Exponent: set the exponent (default 1).
- Symmetric log – logarithmic scaling that supports both positive and negative values.
- Base: set the log base.
- Additional options:
- Domain (min / max) – set custom axis limits.
- Reverse scale – flip axis direction.
- Round limits – round axis limits to cleaner values.
- Use secondary axis – add this field to a second axis.
- Format
- Apply to Axis, Labels, or All.
- Options include number type (Automatic, Number, Percentage, etc.), decimals, display units (e.g. Thousands, Millions), negative value style, prefix/suffix, and thousands separator.
- Axis and Tooltip Toggle whether they are displayed.
#Date fields
When the field contains dates:
- Title Add a custom axis or label title.
- Type
- Discrete – show dates as categories.
- Continuous – show dates along a timeline.
- Sort (Discrete only)
- Natural – chronological order of the values in the column (for example, days of the week run Monday, Tuesday, Wednesday etc. starting from your defined first day of the week).
- Alphabetic – A → Z.
- Column – sort by another column’s values.
- Manual – drag and drop to reorder.
- Scale / Domain (Continuous only)
- Domain (min / max) – set start and end dates for the axis.
- Reverse scale – flip axis direction.
- Round limits – snap axis ends to cleaner dates.
- Use secondary axis – place dates on a second axis.
- Format
- Apply to Axis, Labels, or All.
- Options include date style (short, medium, long), custom formats, etc.
- Axis and Tooltip Toggle whether they are displayed.
#Text fields
When the field contains text/categorical values:
- Title
Add a custom axis or label title. - Sort
- Natural – for strings natural order means alphabetical order of the values in the column.
- Alphabetic – A → Z.
- Column – sort by another column’s values.
- Manual – drag and drop to reorder.
- Axis and Tooltip Toggle whether they are displayed.
Last updated: 03/08/26