Column summaries
#Create a column summary chart
Drag any column from a cell, table, or CSV cell from the data side bar into the canvas to generate an automatic visual summary of that column.

#Summary types
Depending on the data type of your column, different column summaries are created:
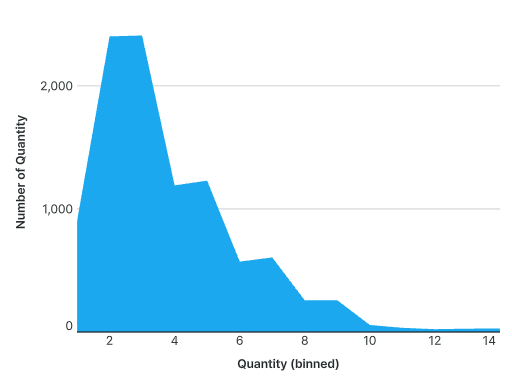
- Numerical columns - binned histograms
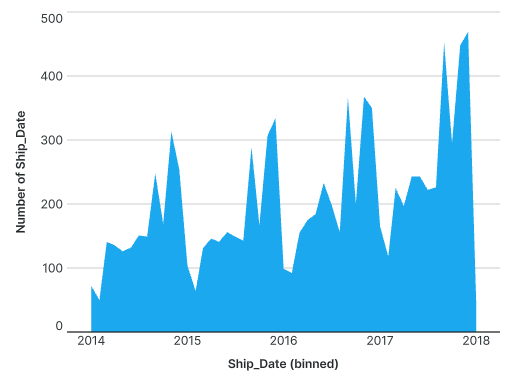
- Datetime columns - time series
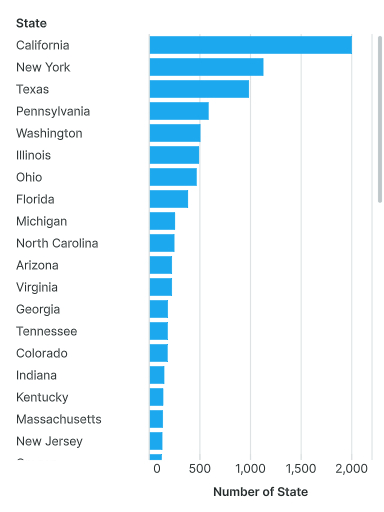
- All other column types - horizontal bar charts
Last updated: 03/08/26