Creating a metric map
Learn how to plan and build a metric map.
Tutorial summary
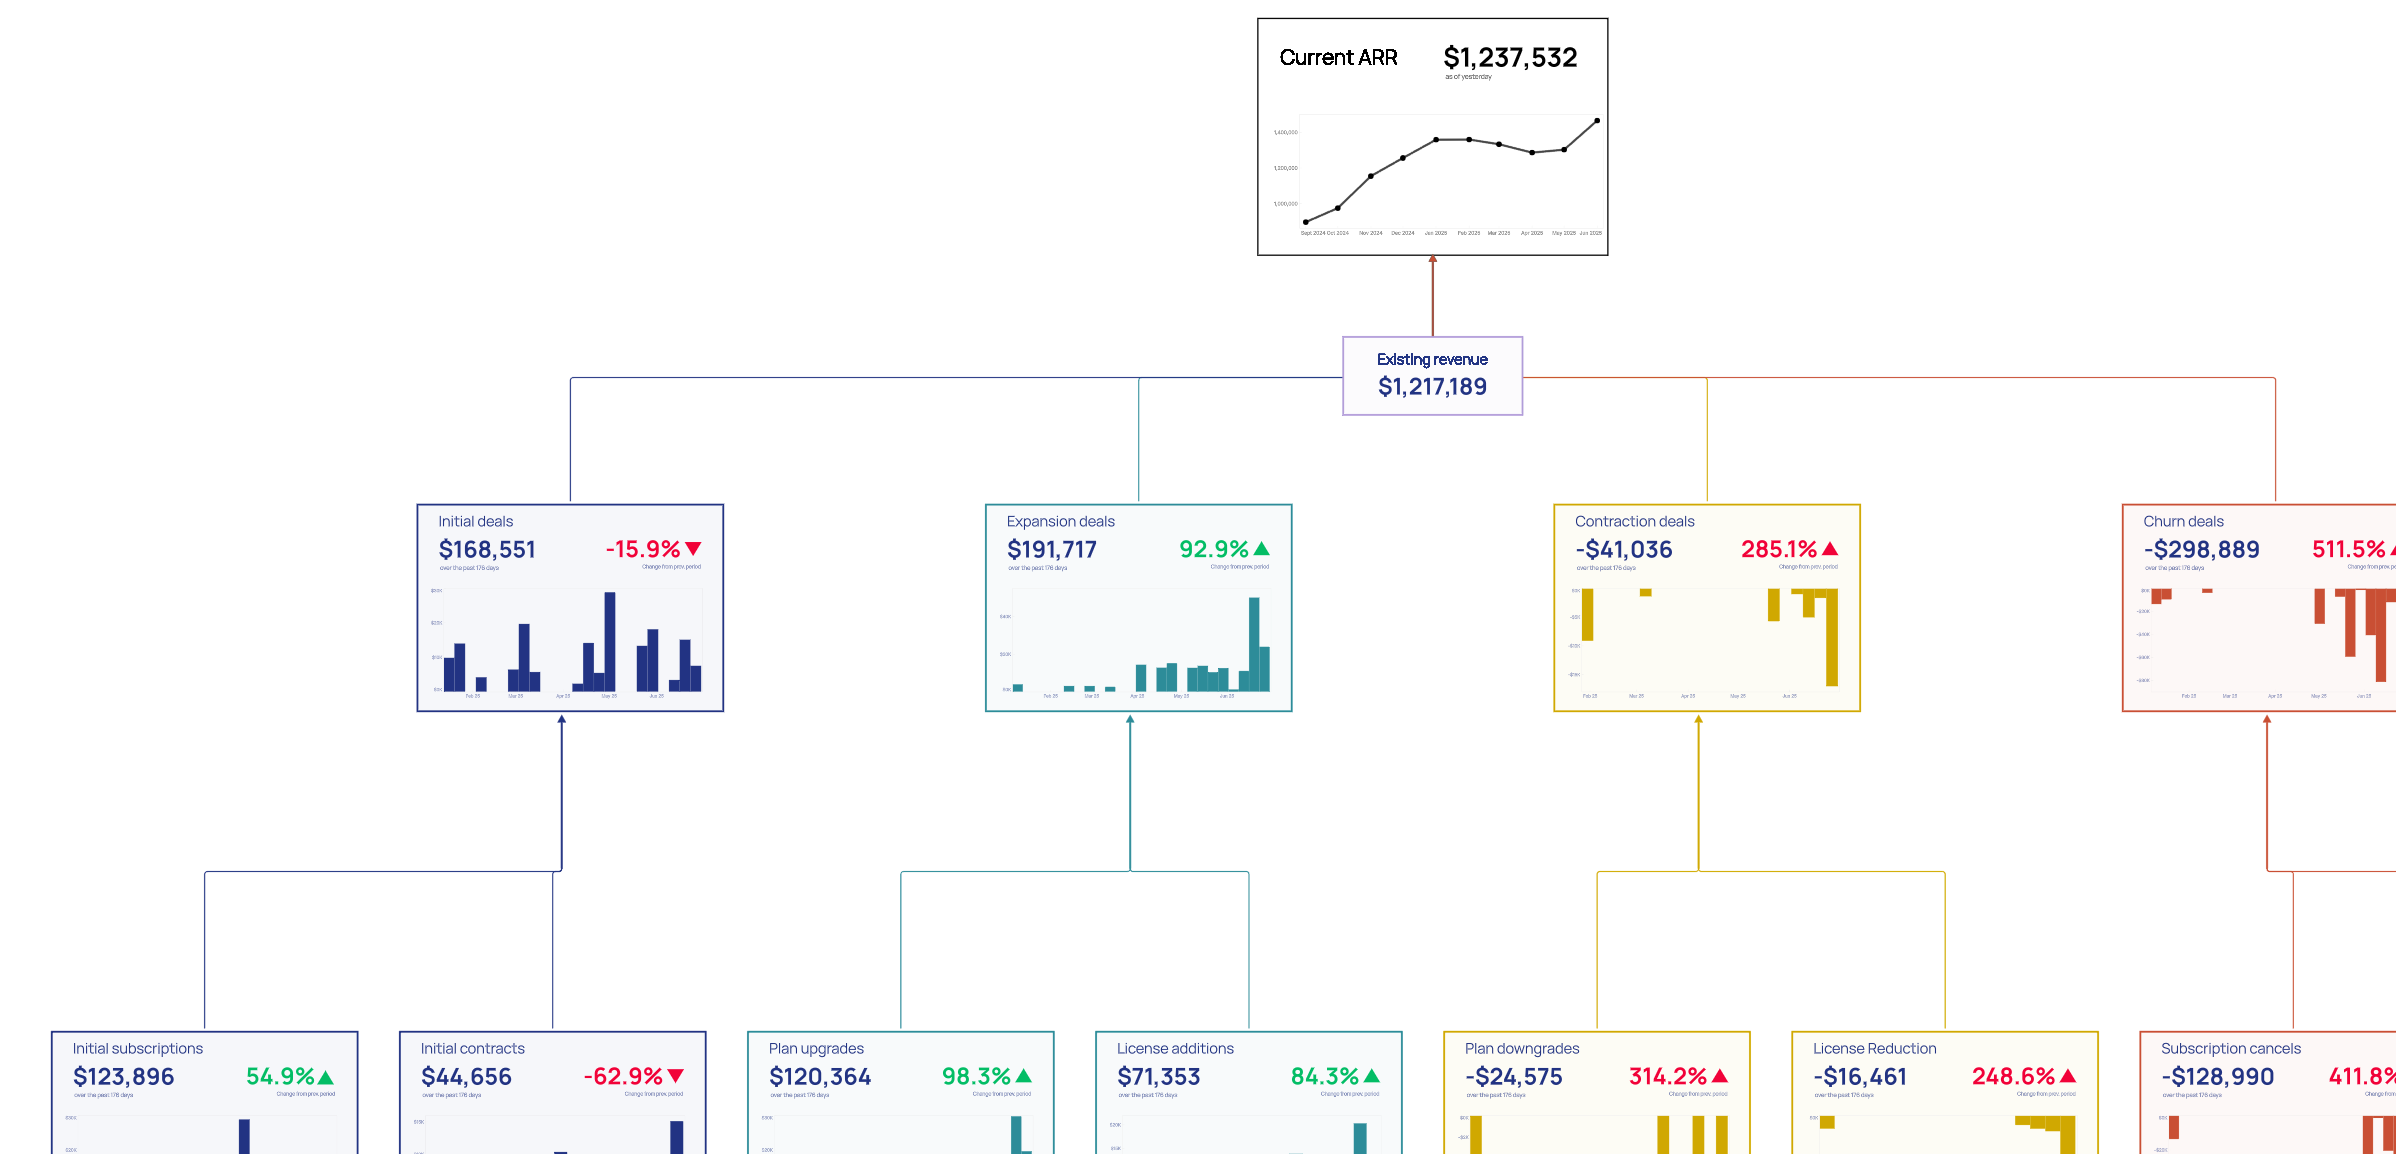
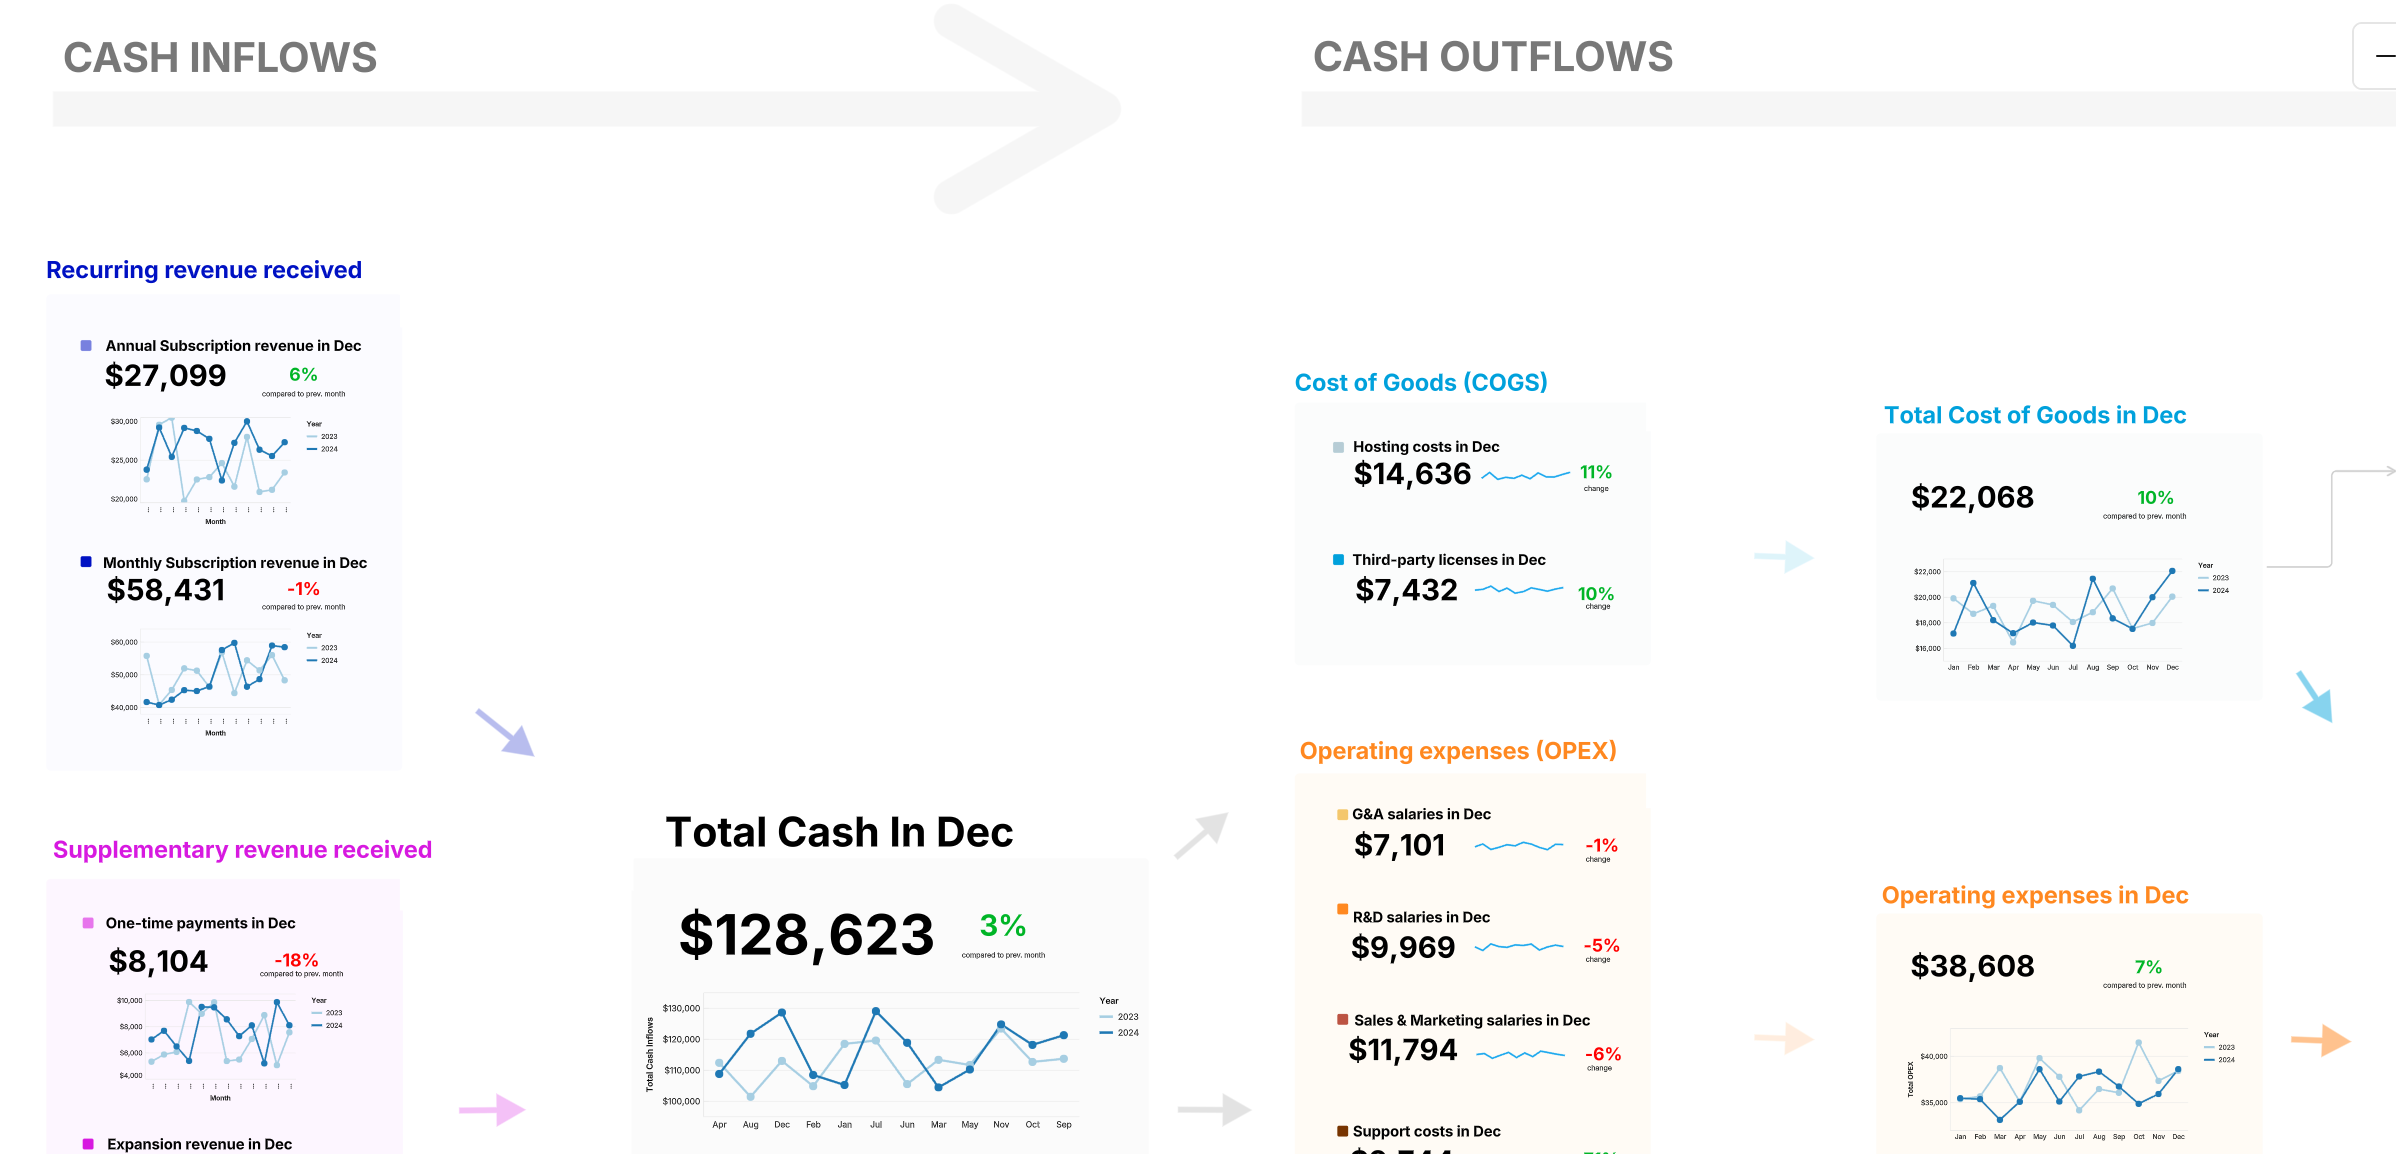
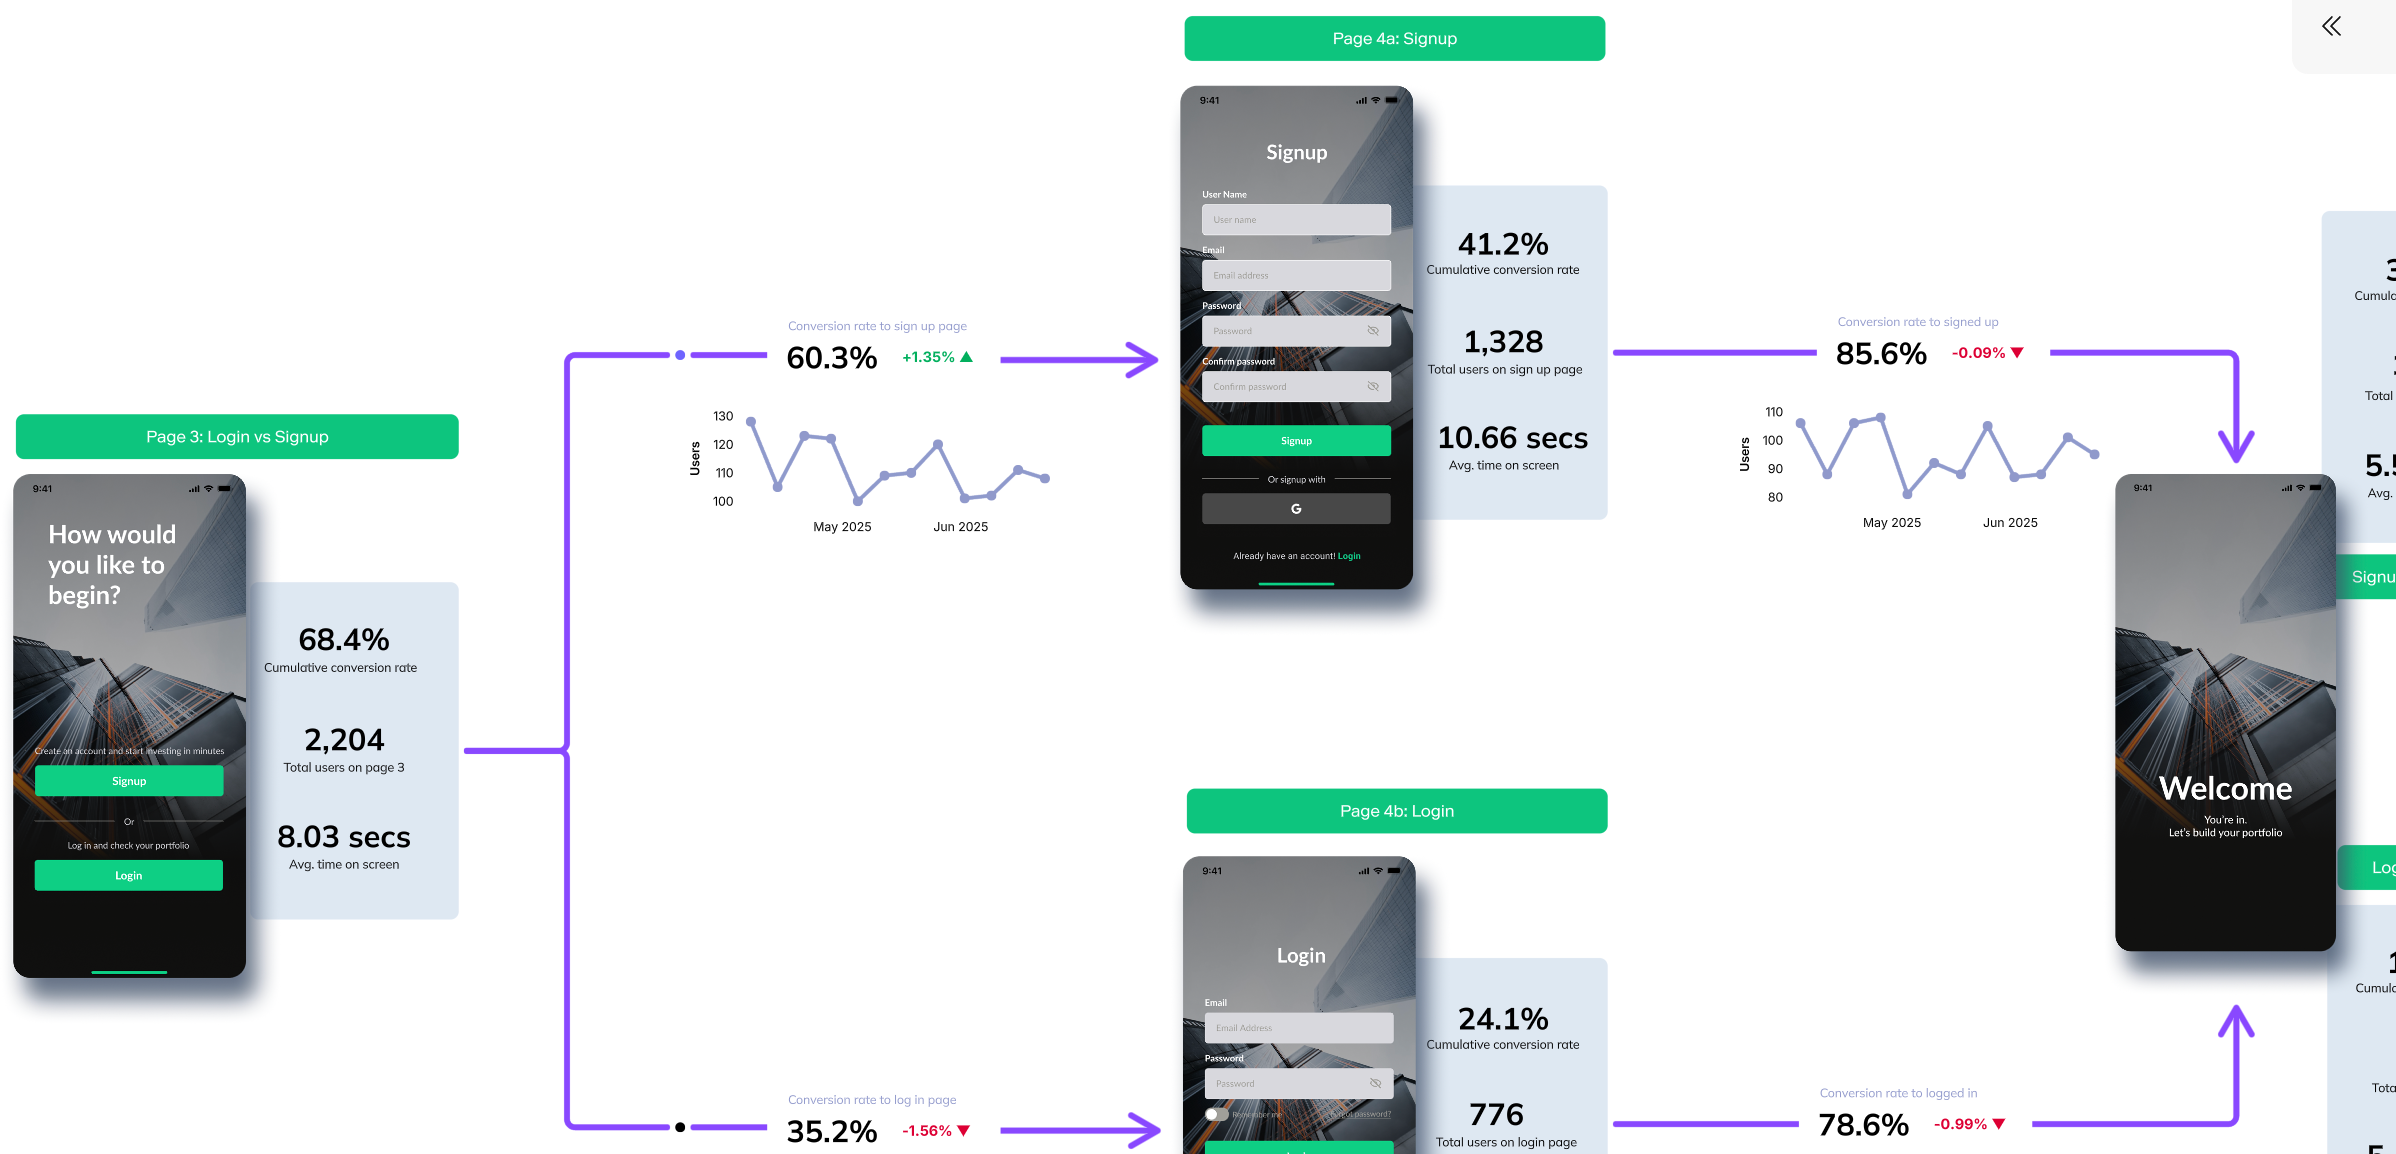
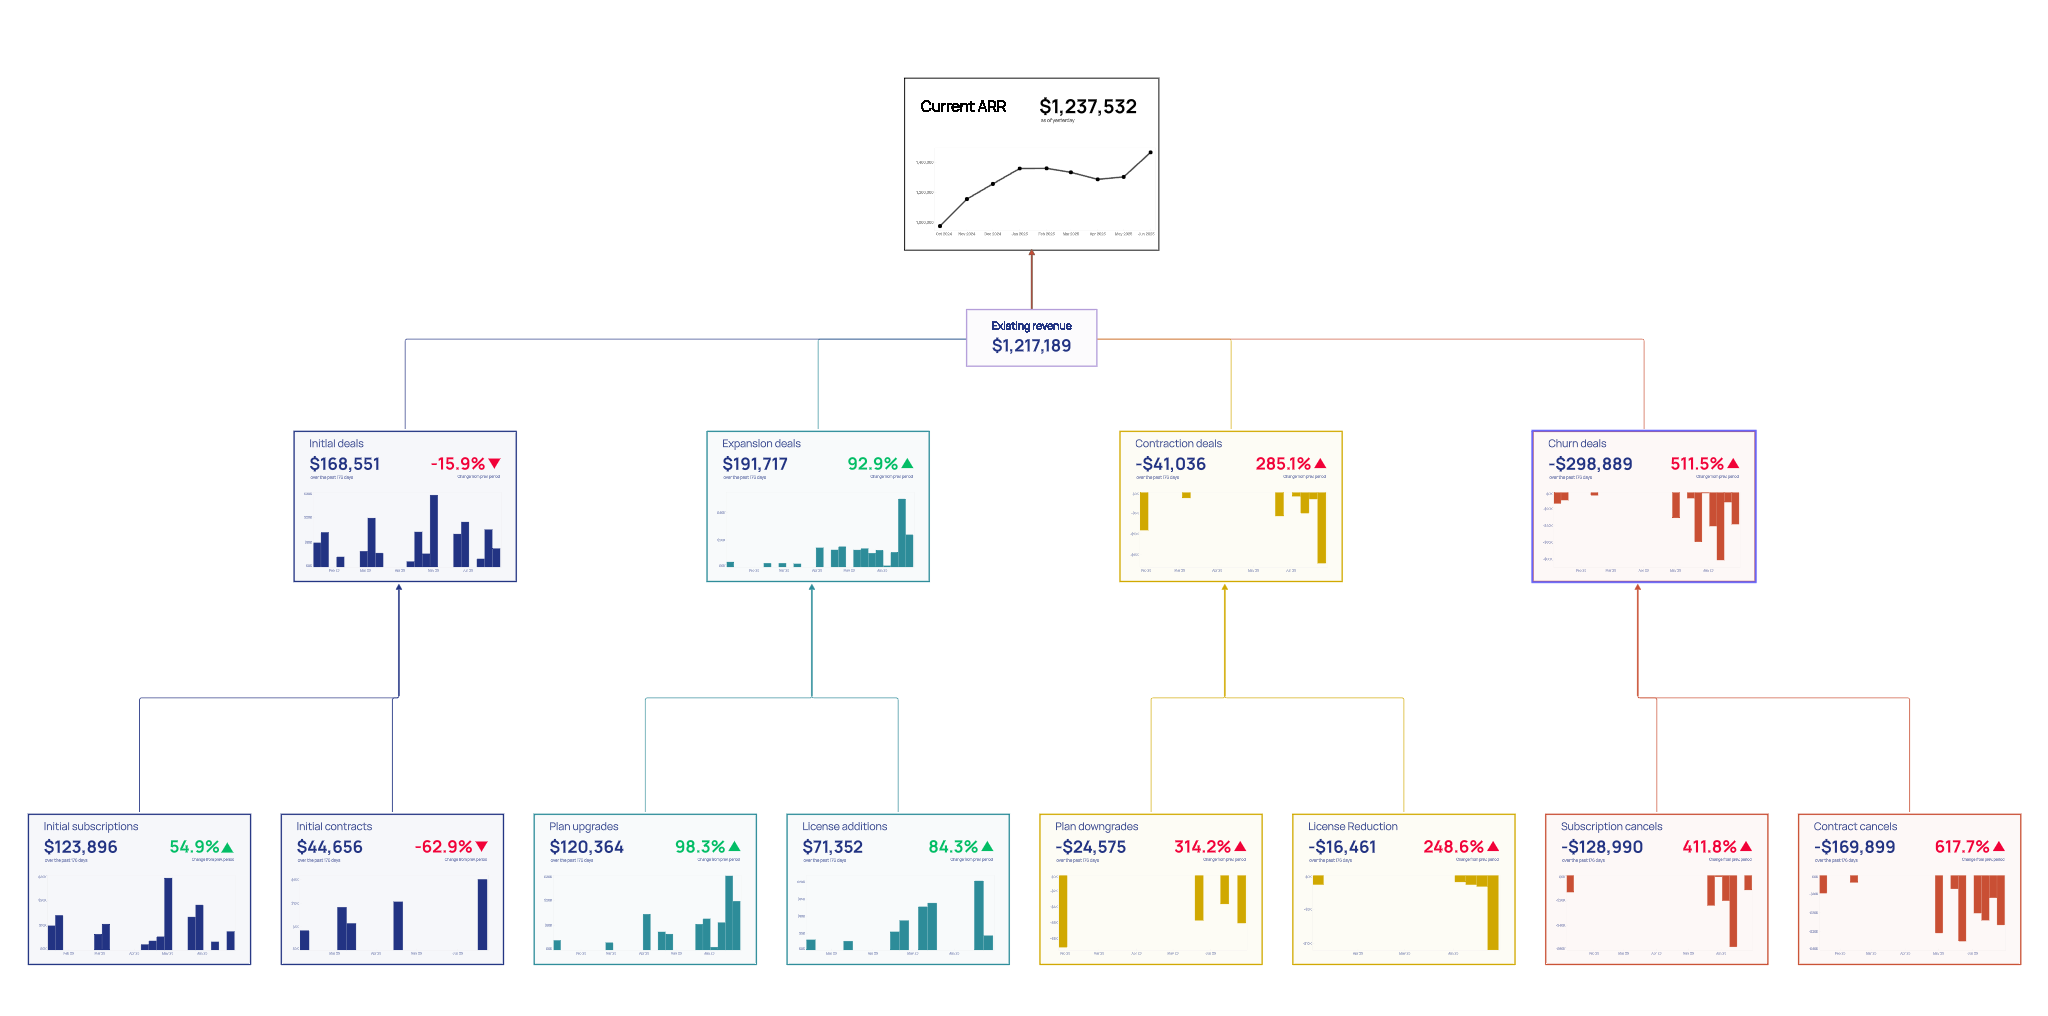
Metric maps bring all your important metrics into one place—the canvas. Build clarity, add context through media and notes, and show causality to identify exactly what's driving change.
What you will learn
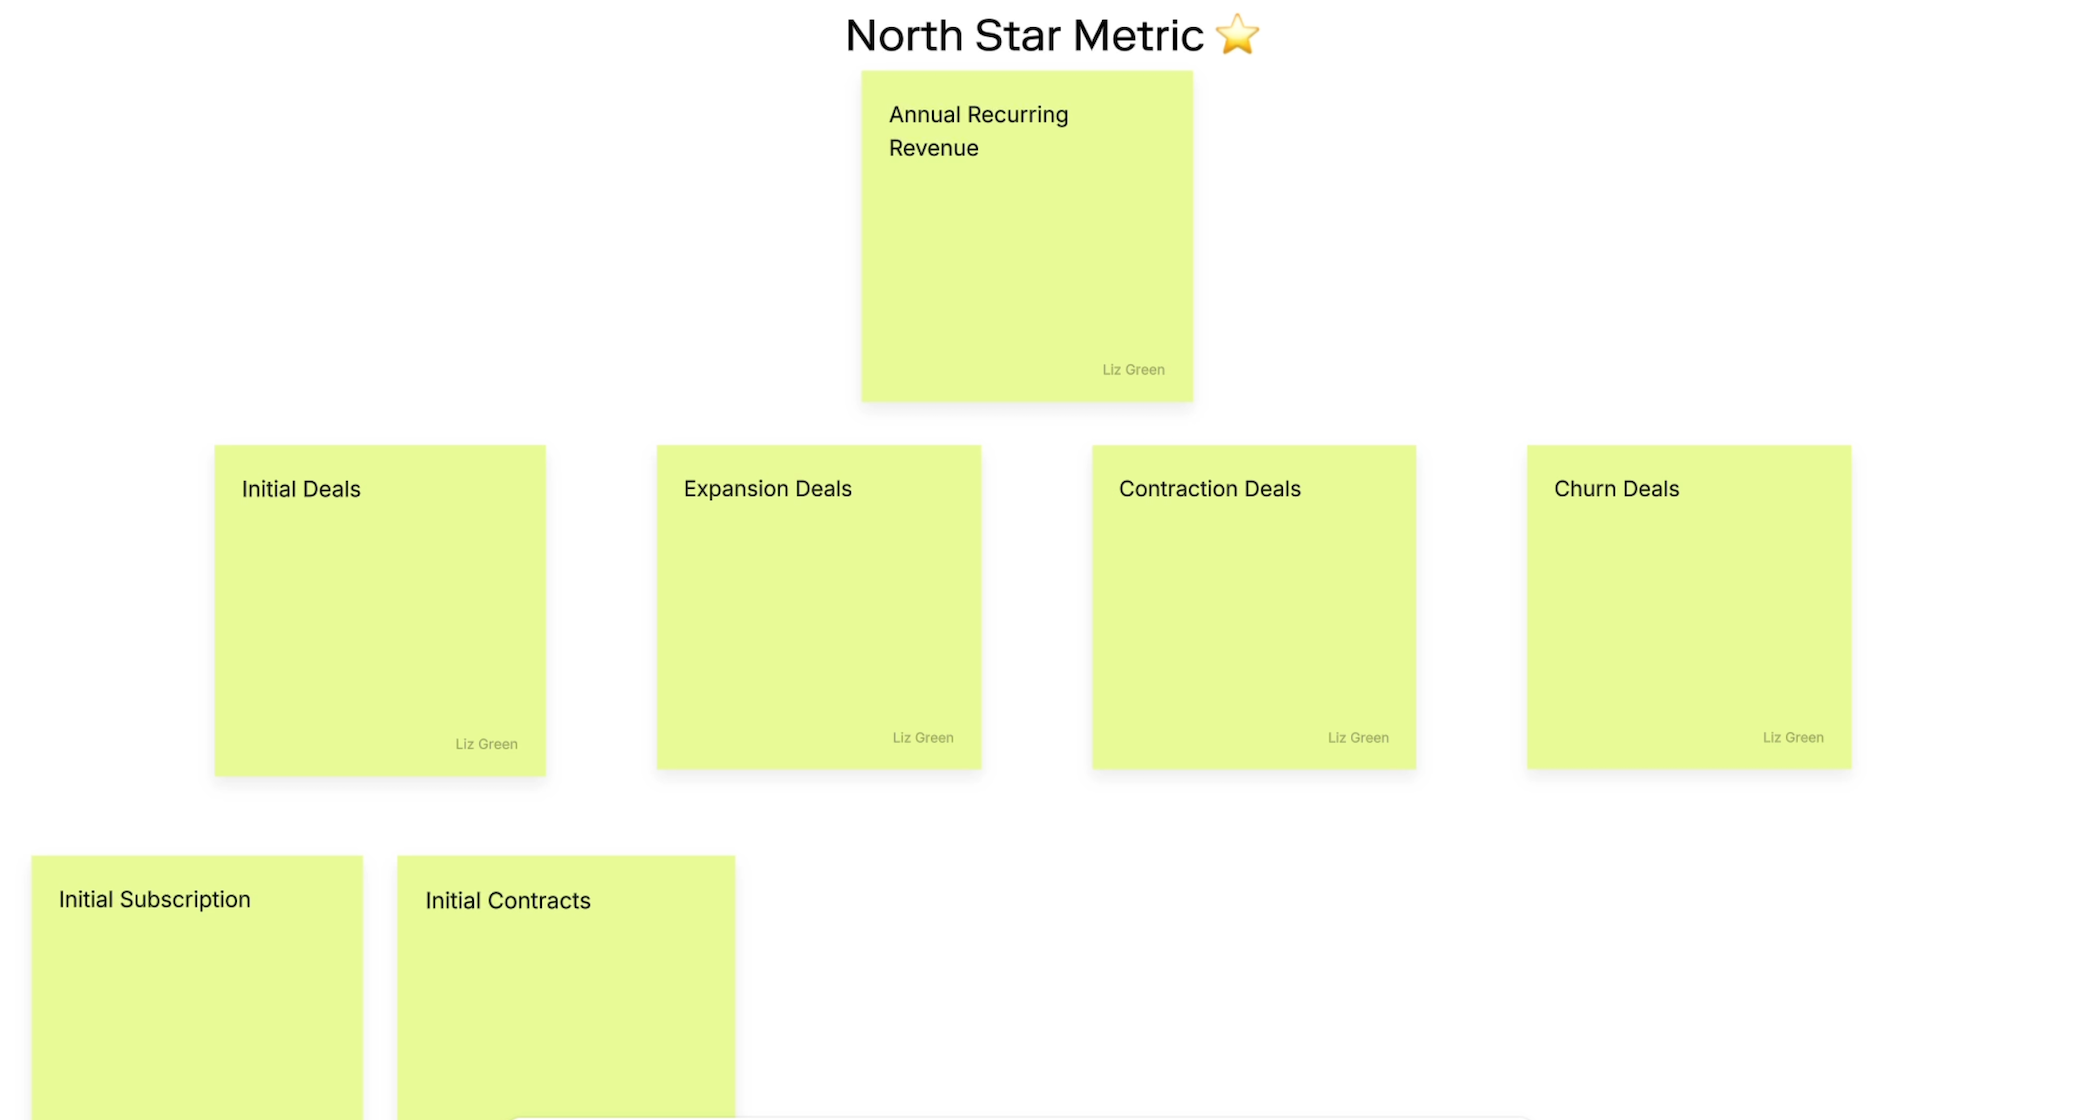
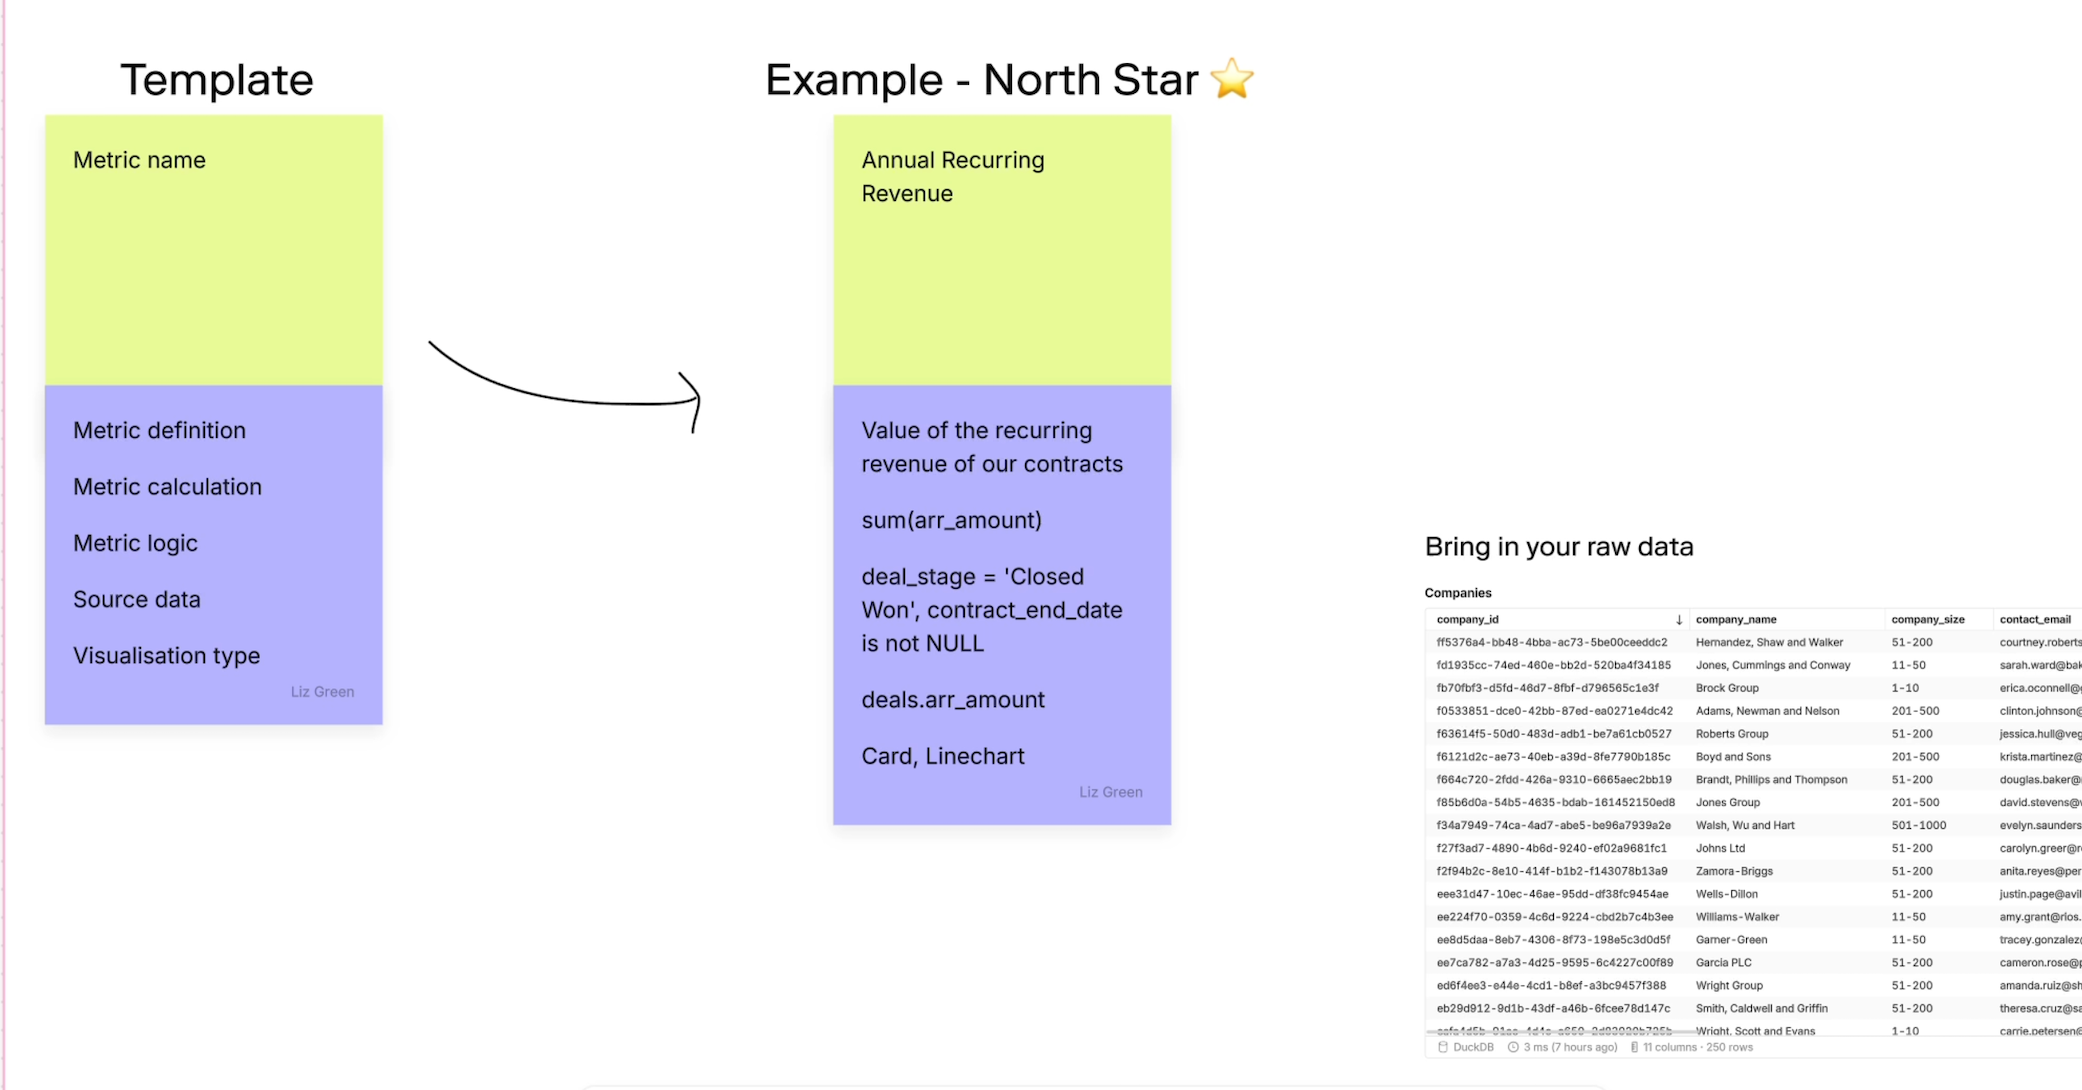
1. Planning - begin by planning which metrics to include in your map. You could use sticky notes. Collaborate on these metrics with other teams and stakeholders to build trust and buy-in on your canvas.
2. Data Validation - define what each metric is, how to calculate it, and any business rules. Check for any data oddities. You could also create a Catalog for consistent metric definitions anyone can use.
3. Building - now you have your metric map structure and your data looks good, time to get creative with designing your cards. Not feeling creative today? Use our metric card templates or browse the Gallery for inspiration.
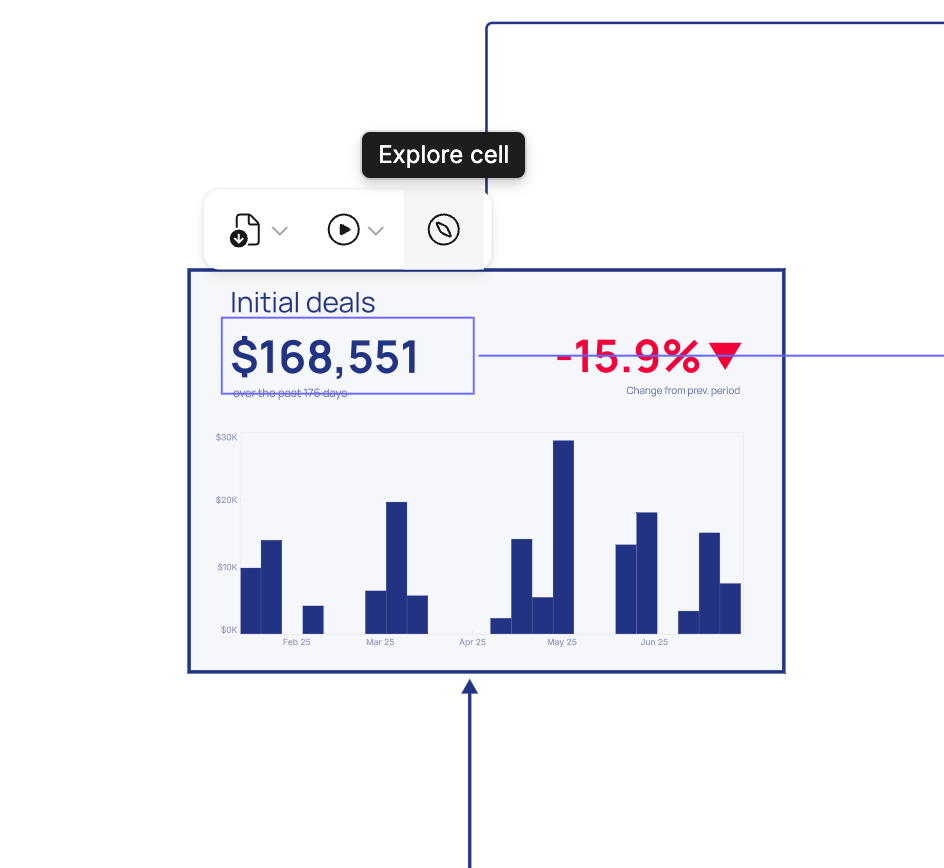
4. Embed - show off your hard work! Bring your canvas into regular meetings and encourage other users to use the 'Explore' functionality which is available when using a Catalog.
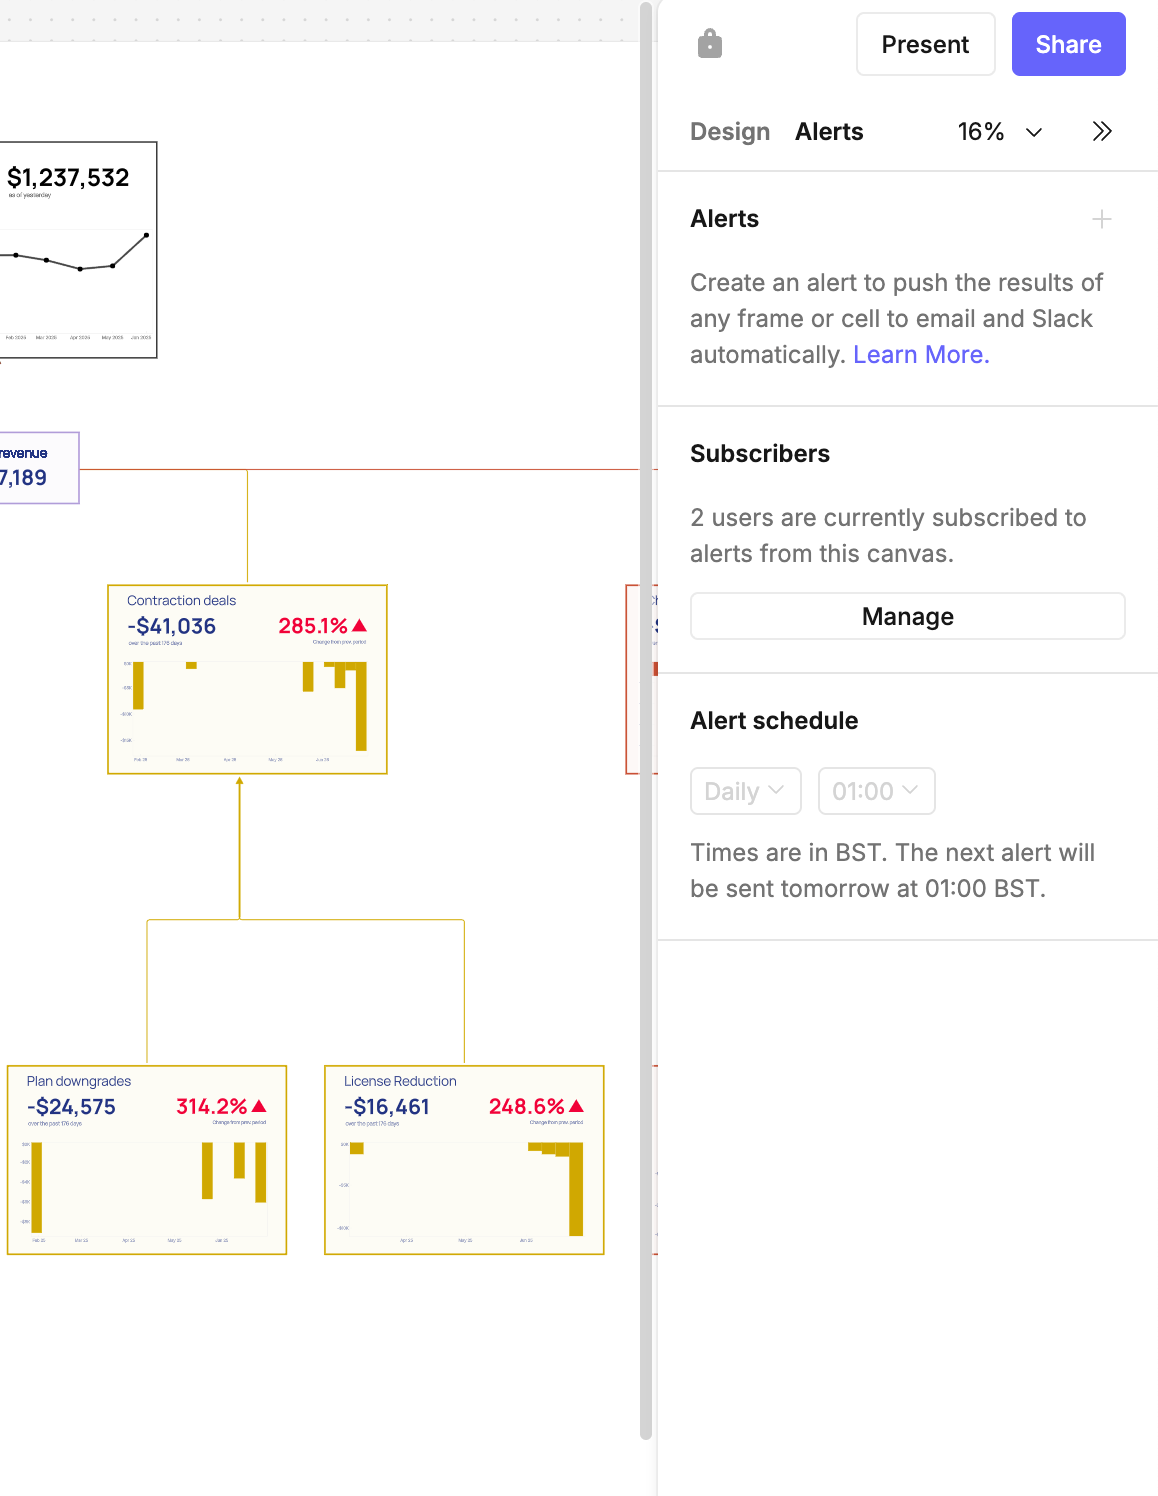
5. Monitor - set up alerts to track important metric changes.
6. Iterate - nothing needs to be perfect first time. Let your canvas evolve with your needs.
Early collaboration is key!
Collaborate early with other teams for collective decision making and early buy-in.
Gallery
There's lots of ways to build a metric map. Check out our varied Gallery examples and see for yourself and have a look at some examples below.