Reports And Slides
Count supports presenting canvases in two ways:
• Reports: Scrollable frames with an easily accessible navigation bar that allows for more complex and taller, document-style layouts.
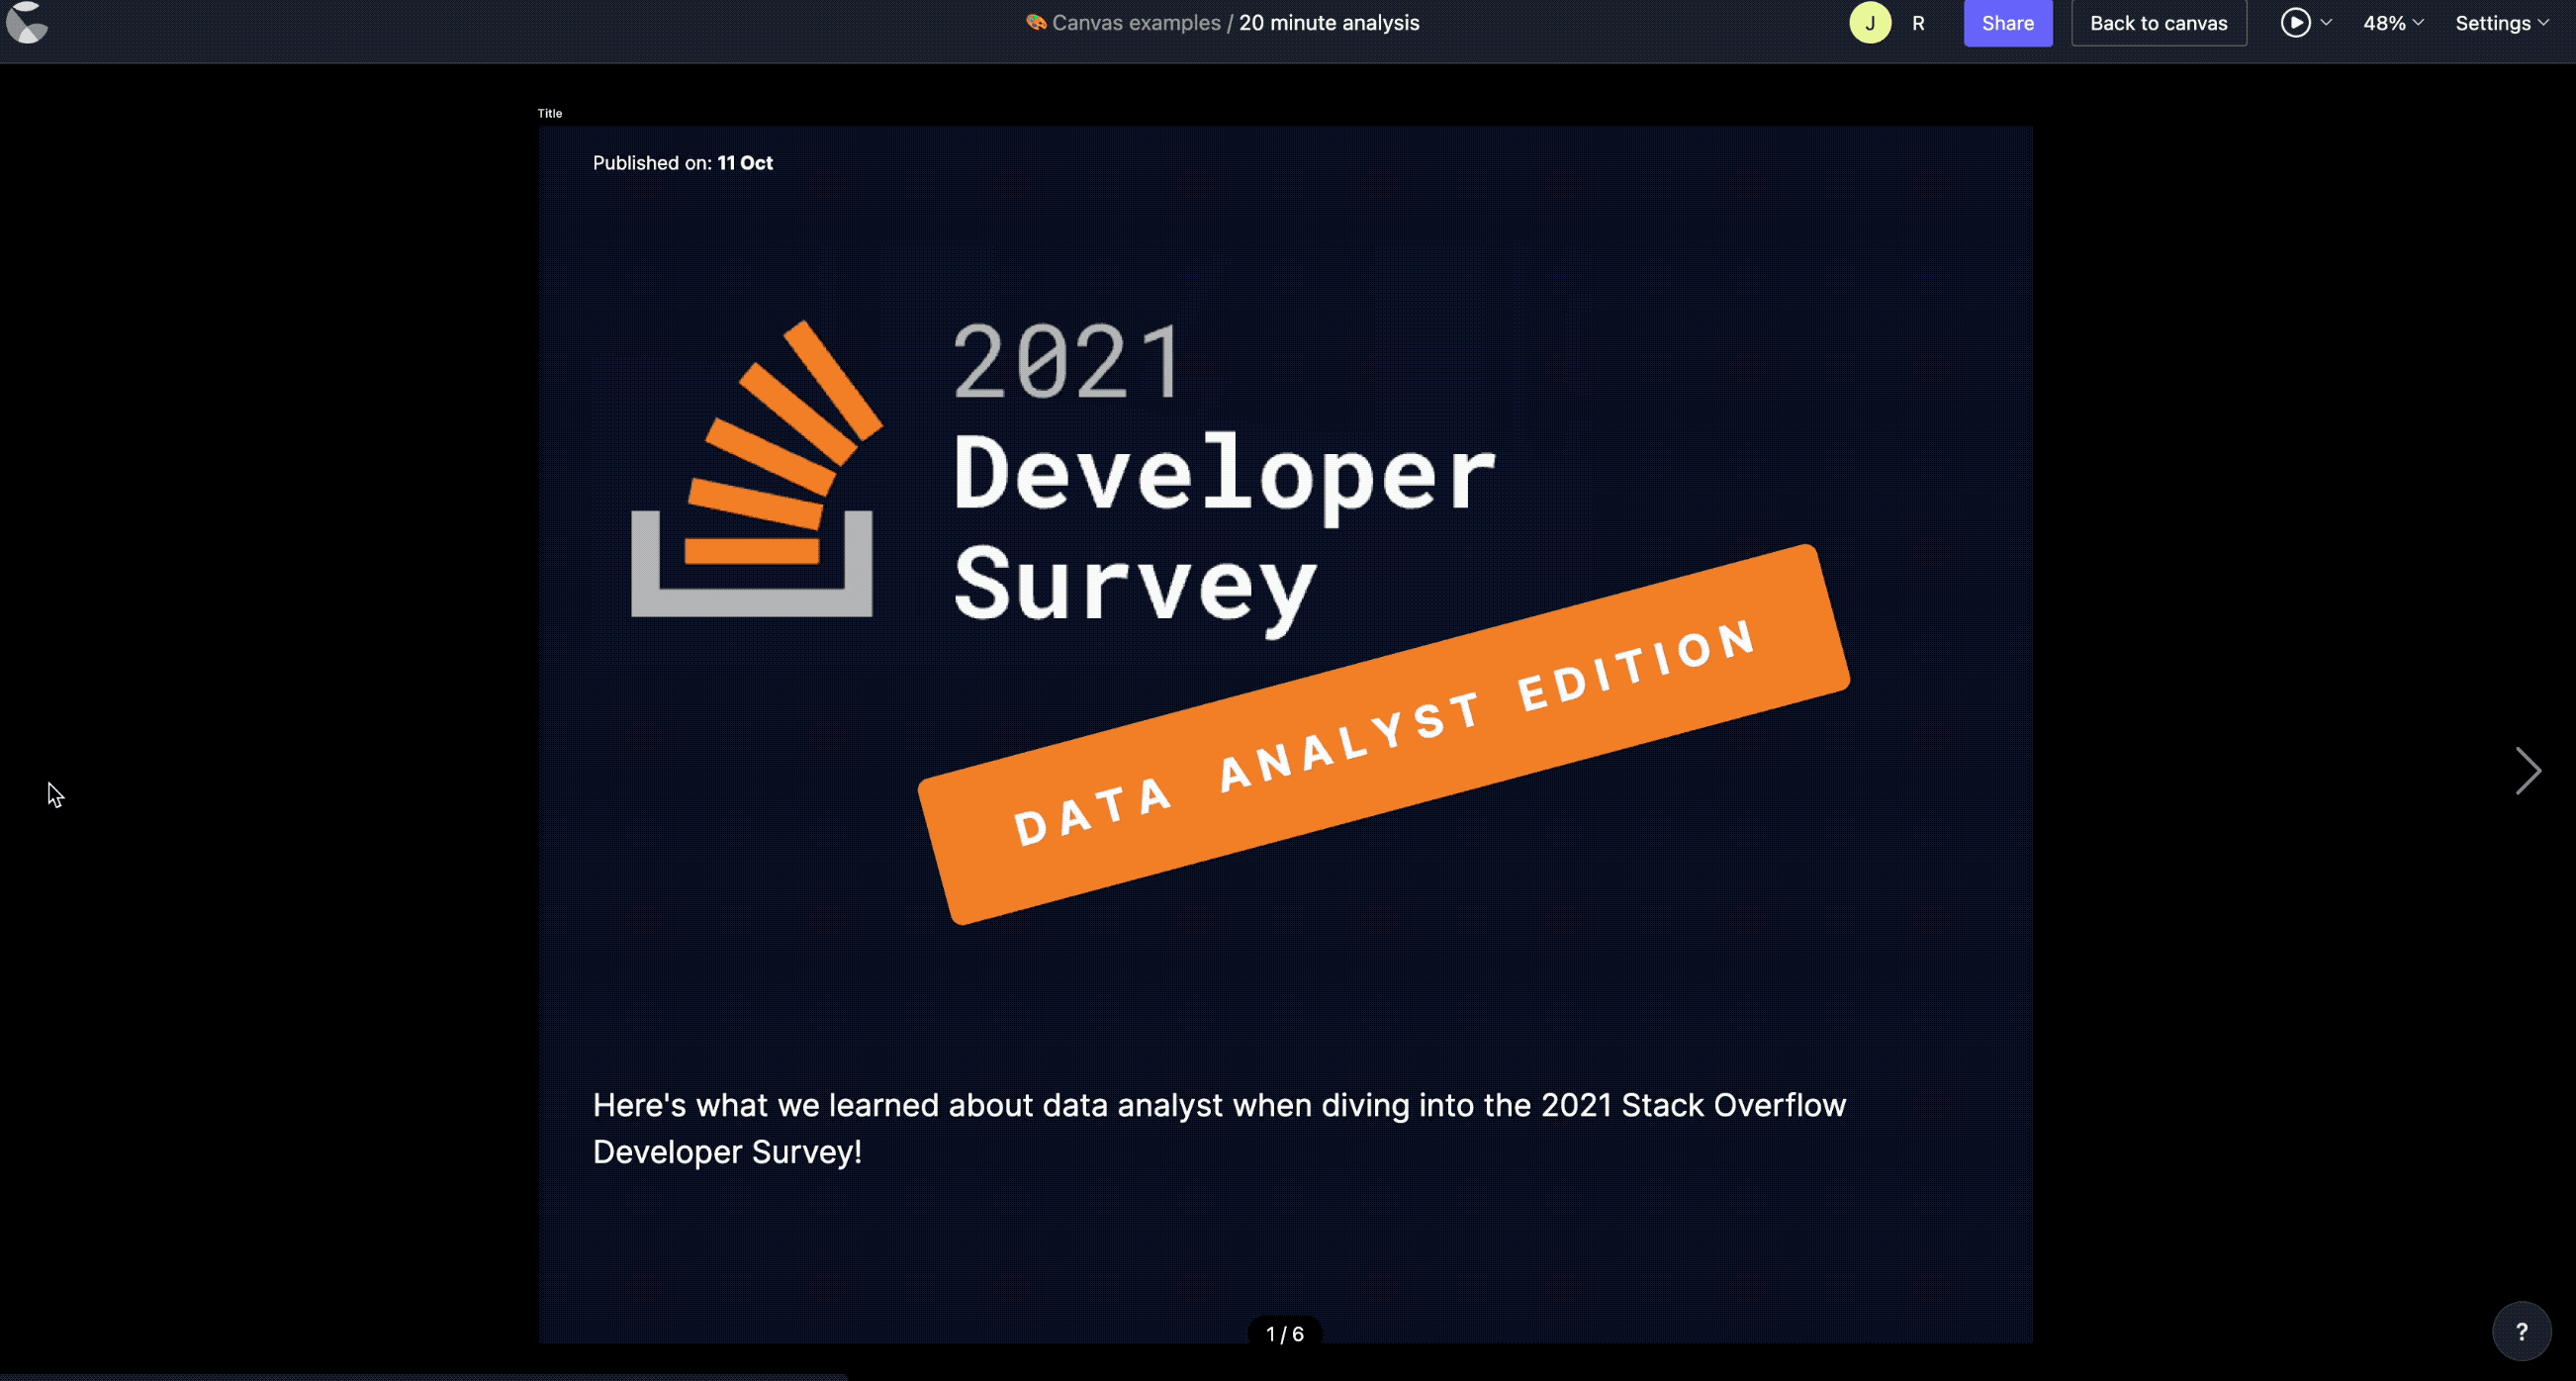
• Slides: Fixed frames with a dark user interface for showing your canvas as slides is perfect for presenting on screen or making fullscreen "information radiator" views.
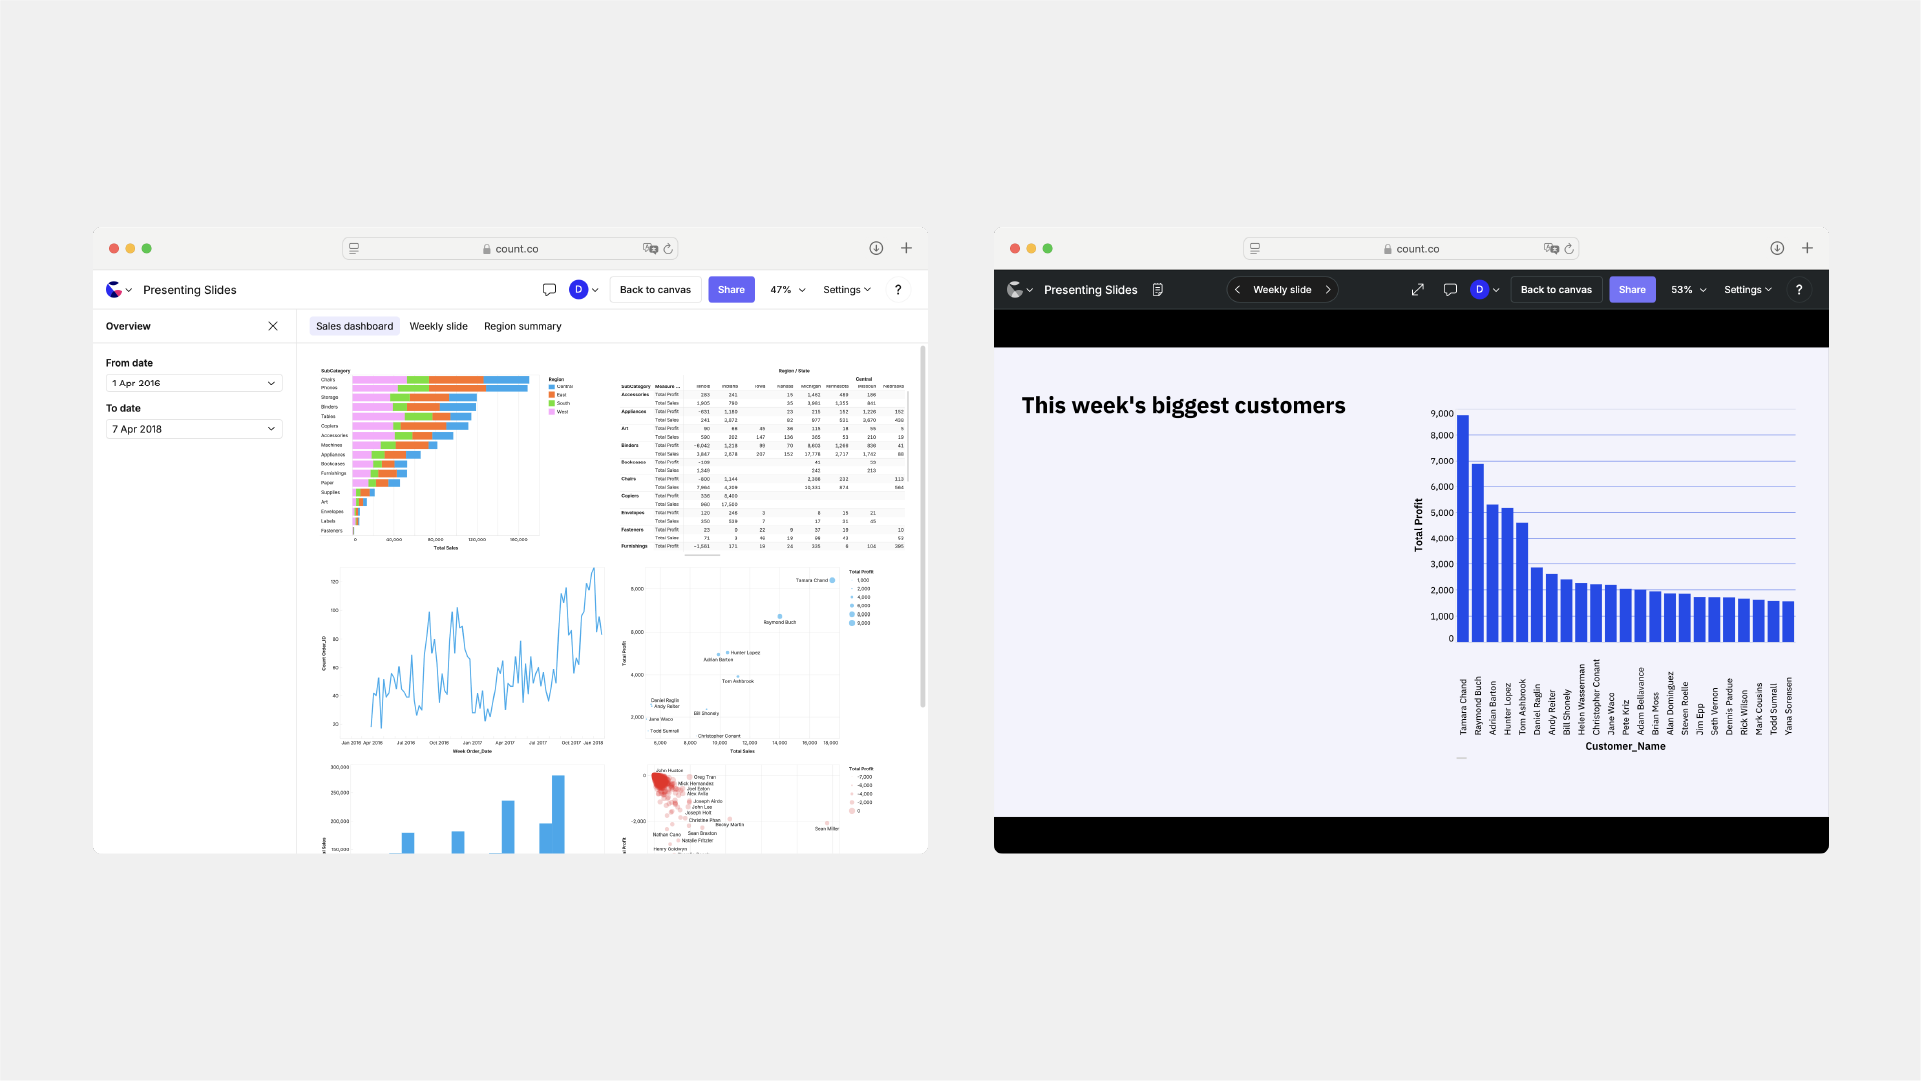
To begin, ensure that you have at least one frame, and then click Present in the canvas navigation bar. To exit, click Back to canvas, or use the Esc keyboard shortcut.
Settings
In the top right of the screen is a button to control the view options:
- Report / Slides - toggles between the two presentation methods.
- Shown in report - choose which frames appear. Drag frames up or down to reorder.
- Hidden in report – frames that won’t appear in the report.
- Unavailable for report – frames that are either:
- Nested inside another frame (the contents will still display within the parent, but the frame itself cannot be selected), or
- Explicitly hidden from the report.
- Default view – You can control how the report opens for viewers by setting a default view. This ensures that when people open your report, it displays in the way you intend — whether that’s a high-level overview (Fit to screen) or a more detailed, close-up view (Actual size or Custom).
- Fit to screen – scales the frame so the entire canvas fits inside the viewport.
- Fit to width – scales to fill the available width (recommended for most dashboards).
- Fit to height – scales to fill the available height.
- Fill screen – expands the canvas to fill all available space.
- Actual size – displays the canvas at 100% zoom.
- Custom – allows a specific zoom level to be set.
- Show report by default - links to this canvas from your workspace will default to the report URL
When in the slides presentation mode, the following additional settings are shown:
- Autoplay - enable auto-cycling through frames in this report. This is helpful if your report is designed to be viewed passively
- Time per frame - the time before the next slide when autoplaying
Sharing slides and reports
Clicking the Share button while viewing a report opens the Share menu
- Selecting Share to web shares the report publicly, with options to share both the canvas and presentation, or the presentation only.
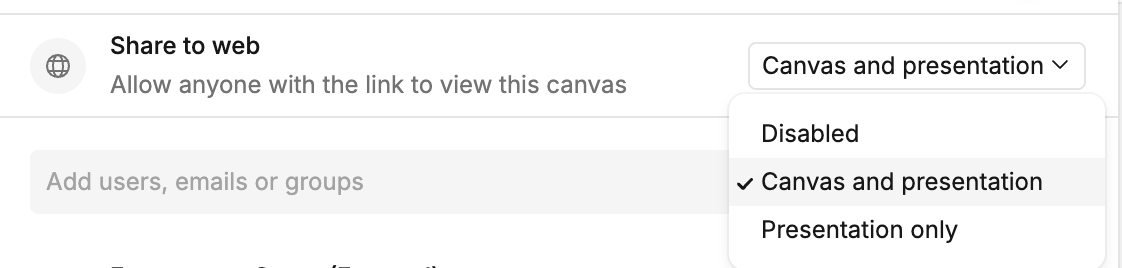
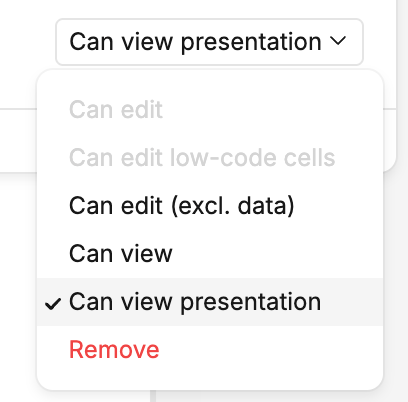
- To share reports with people but not canvases, ensure that the Can view presentation option is selected.
Info
Note that other workspace members may be able to view the canvas if the canvas is shared with the project or workspace, or if the project is shared with the workspace.
Commenting
You can comment on reports just as you do in canvases:
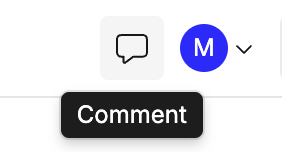
- Use the
Cshortcut, or click the comment icon in the navigation bar. - Any workspace member or guest can leave comments.
- Comments outside report frames aren’t visible in the report view, but remain in the canvas.