Migrating From Tableau To Count
Many teams find Tableau a limiting factor as their analytics ambitions grow, built for dashboards, not for the way modern data teams actually work. Count is designed for the full analytical workflow: exploration, collaboration, self-service, and AI-powered analysis, all in one canvas.
And the good news: most teams make the move gradually, without the pressure of a large-scale, all-at-once migration. A more organic approach reduces overhead whilst maintaining business continuity.
The benefits of migrating
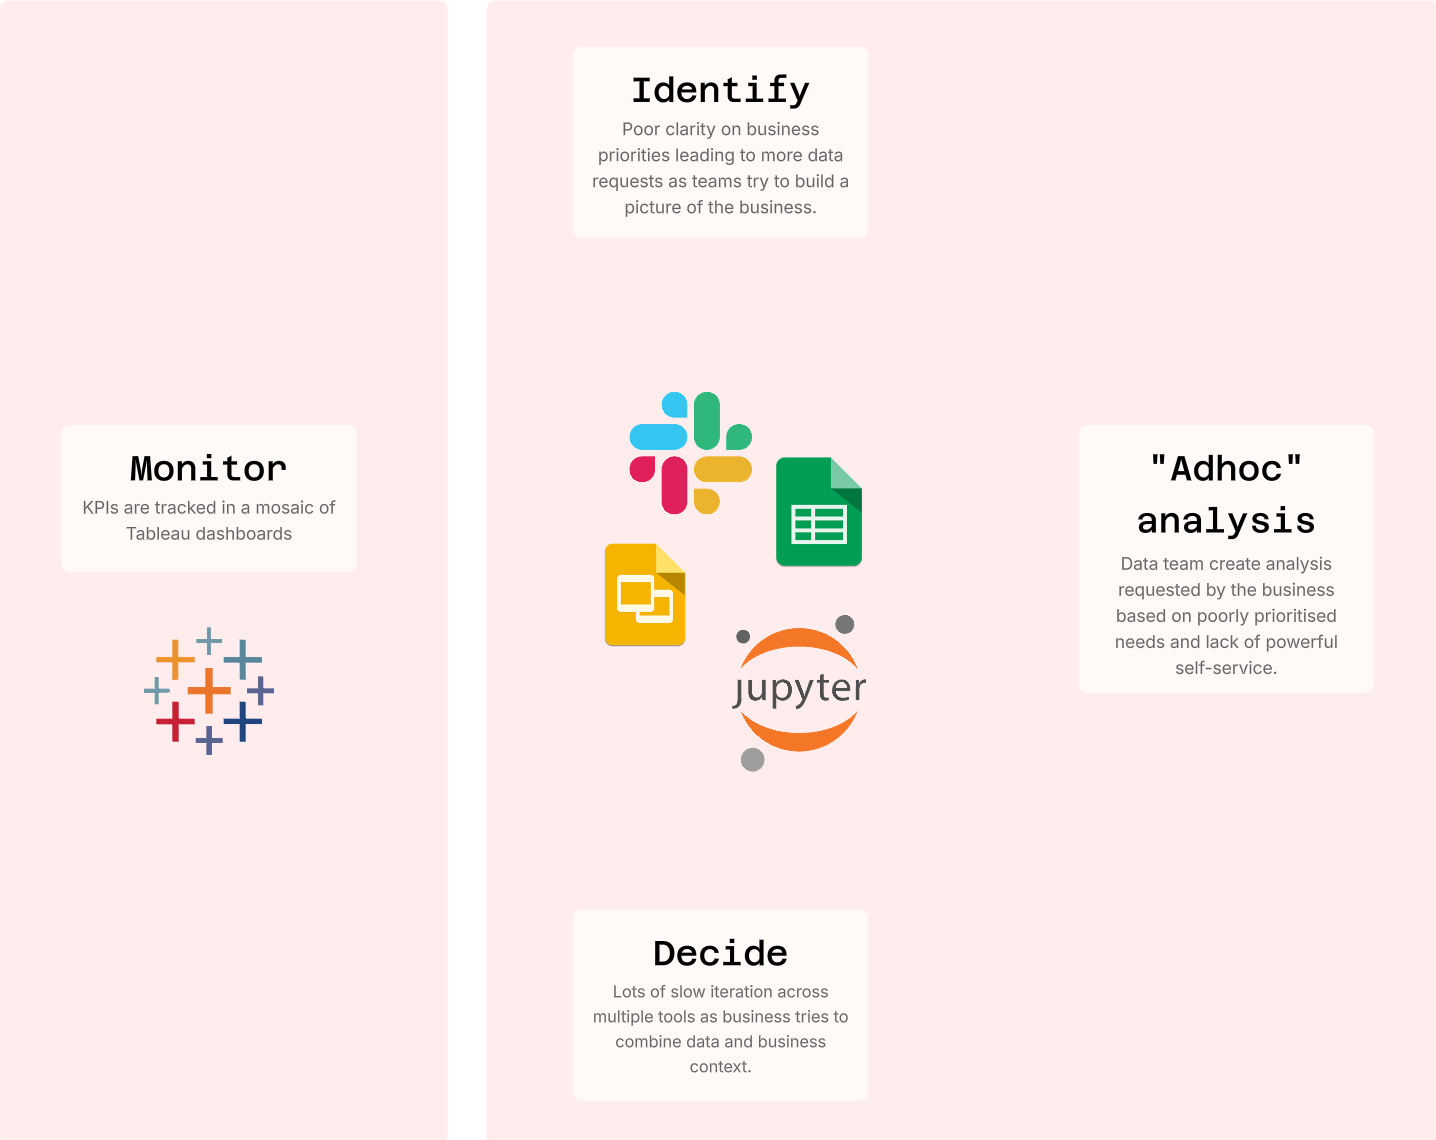
Count brings your entire analytical workflow into one place: exploration, documentation, collaboration, and presentation. Without it, Tableau teams typically face:
- Unstructured processes which are slow and fragmented
- "Insights" created across different tools, showing different numbers
- Data teams become siloed support functions
- Poor data governance due to Tableau's lack of single data model
Using Tableau with Count
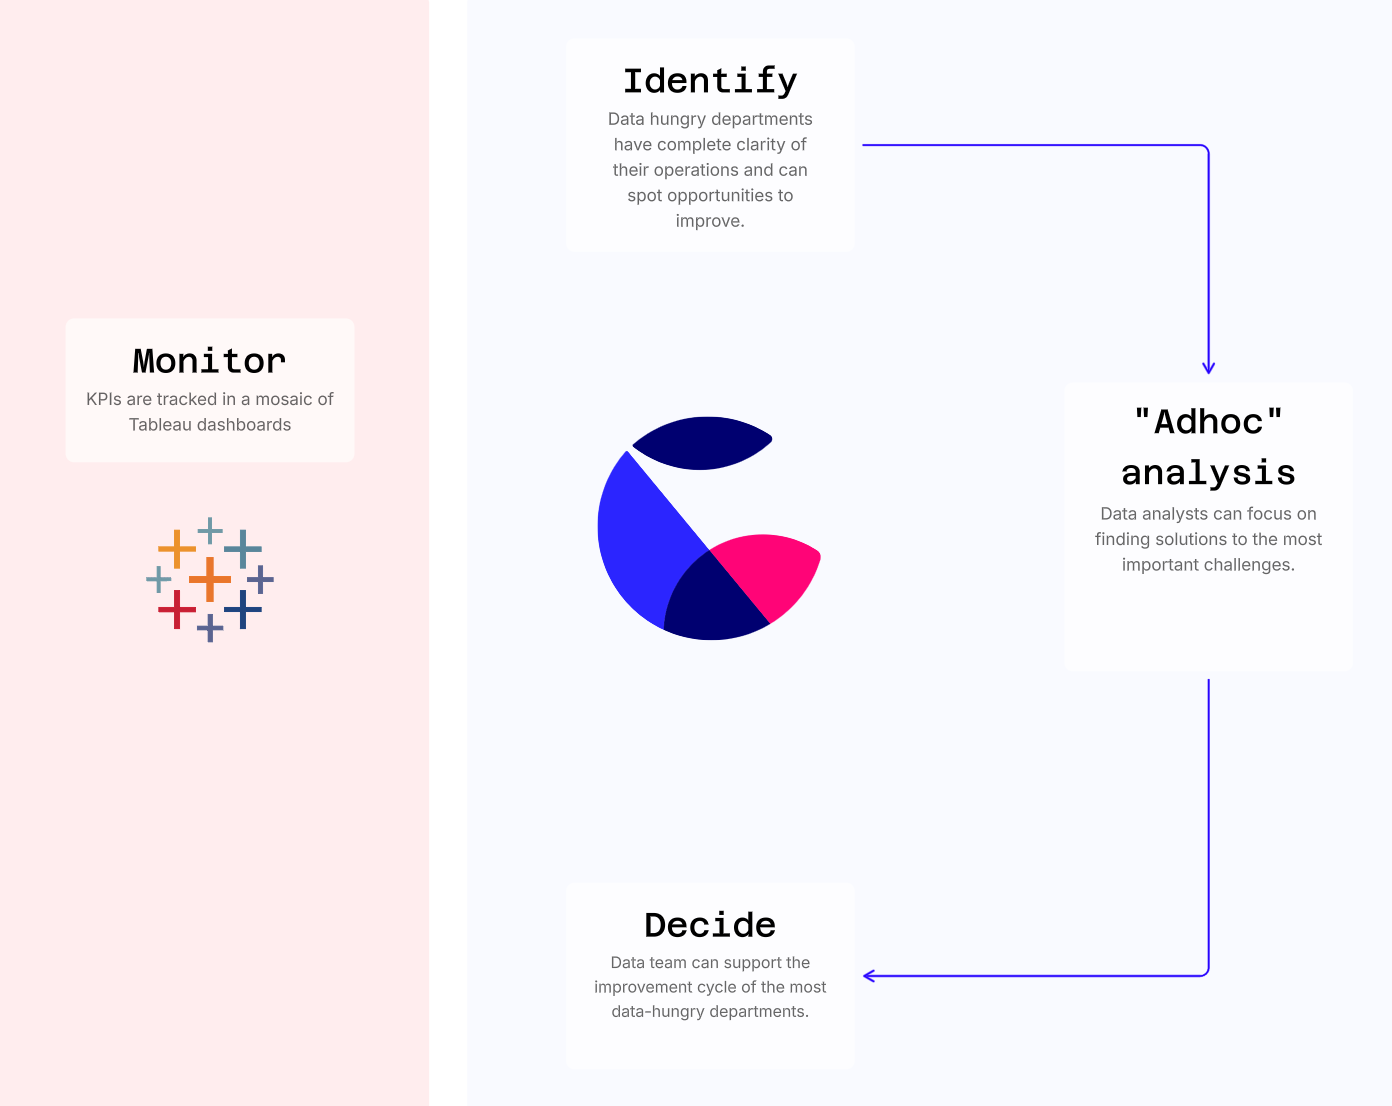
If Tableau is still required, it can handle top-level KPI reports and simple self-service while Count becomes the engine for deeper analytical work.
Many teams start this way. Analysts move to Count first, then operational teams follow, and reports migrate naturally as people stop going back to Tableau. Count connects to any datasource and uses advanced analytics to collaborate and identify the biggest opportunity areas for the business.
Steps to migrate
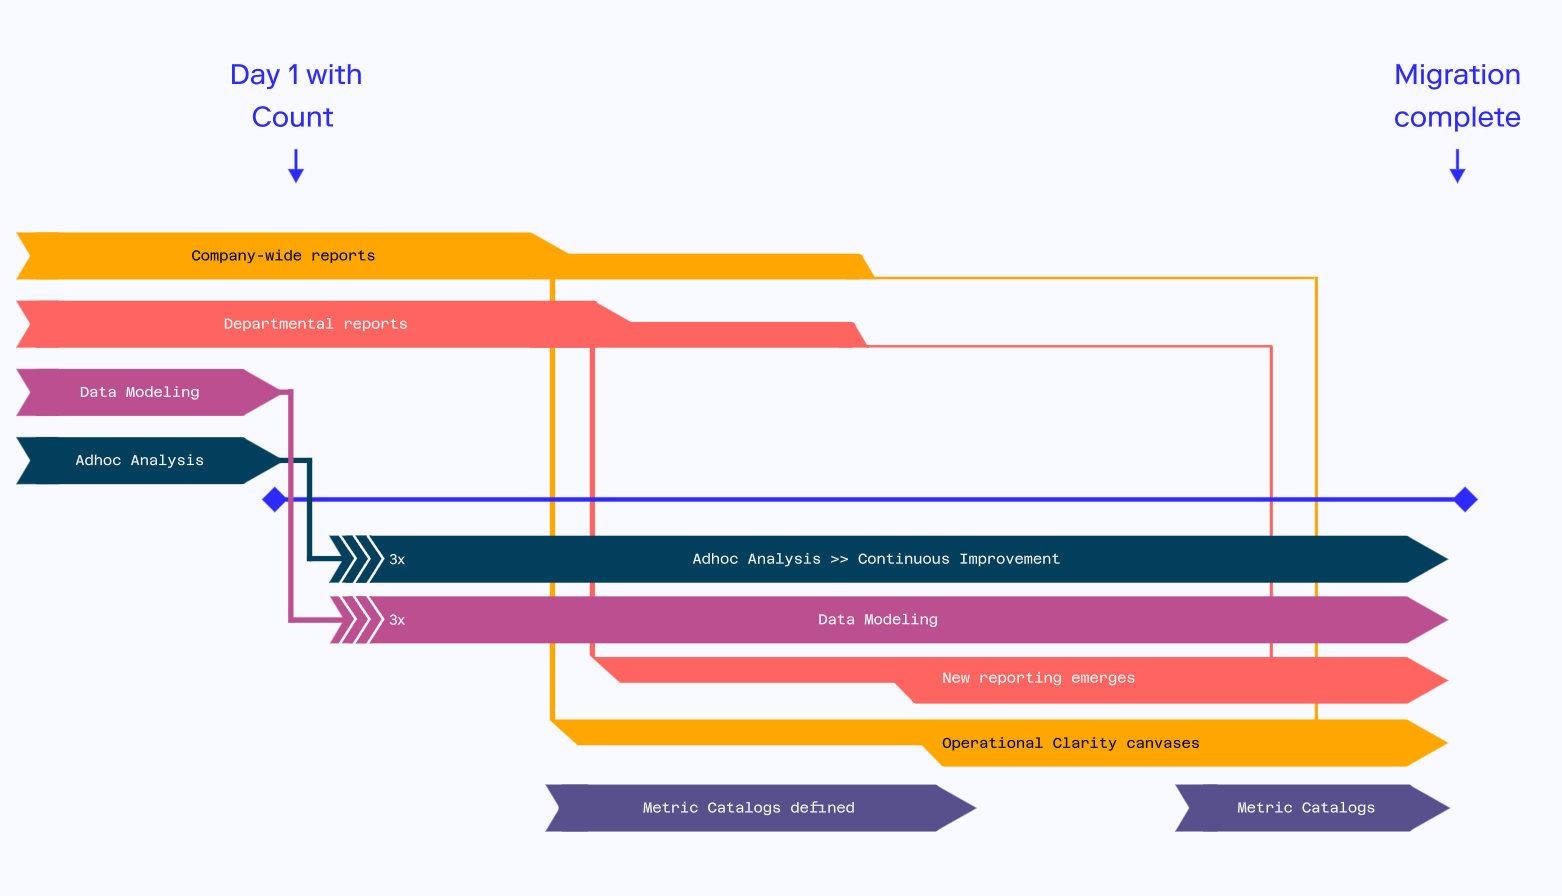
Step 1: Move exploratory analysis to Count
Analysts use Count to explore data, fix bugs, and collaborate with business teams, making ad-hoc analysis around 3x faster.
Step 2: Build operational clarity canvases in initial teams
Data teams create operational clarity canvases in key departments like Product, Growth, and Go-to-Market, helping teams quickly spot opportunities.
As ad-hoc analysis evolves and new metrics emerge, teams naturally build their top-level reports in Count instead of returning to Tableau.
Step 3: Define data models for initial teams
As metrics and operational reports get developed, the data team start to build out metrics Catalogs in Count, creating the documented, governed semantic layer that powers both self-service and AI agent queries.
Step 4: Migrate any remaining departments
At this stage, most of the data team's daily work lives in Count. The final step involves migrating occasional-use reports (like finance dashboards or company-wide metrics) and establishing self-service data models for each team.
Step 5: Complete migration and turn off Tableau
Keep tracking usage of Tableau reports to spot any remaining reports to migrate. Flag in these reports a deadline when they will be turned off and offer support to help migrate to Count.
AI-powered analysis, built in
Unlike Tableau, where AI is bolted on as a separate product, Count's AI agent is native to the canvas. Your team and your stakeholders can ask natural language questions in Slack and get fully traceable, editable canvases back, not disposable chat outputs. Every chart the agent produces has full lineage, so analysts can interrogate, repurpose, and build on it.
For teams focused on governance and documentation, Count's telemetry database gives visibility into how people are using data across the organisation: which questions are being asked, which assets are being accessed, and where coverage gaps exist. The better your documentation, the better your AI.
Your new day-to-day post-Tableau
Count transforms your entire business into a data-driven powerhouse, bringing all your metrics under one roof while letting everyone explore data their own way.
- Faster decisions — decision-making is accelerated with Count's collaborative, centralised approach
- More cost efficient — data warehouse cost is reduced due to Count's semantic layer caching
- Clear answers — metrics are defined, managed and contextualised in one place, so problems and opportunities are clearly visible
- AI that actually works — because your data is governed and documented in Count, the AI agent has the context it needs to give reliable answers
- Self-service that scales — stakeholders can ask questions via Slack and get interactive canvas outputs without waiting for the data team
- Empower all teams with data — every team becomes a data team