Explore From Cell
The Explore cell feature in Count Metrics enables users to dive deeper into data directly from a visualization within a shared canvas.
This feature streamlines the process of running additional analysis and gaining insights without disrupting the context of your current work.
How it works
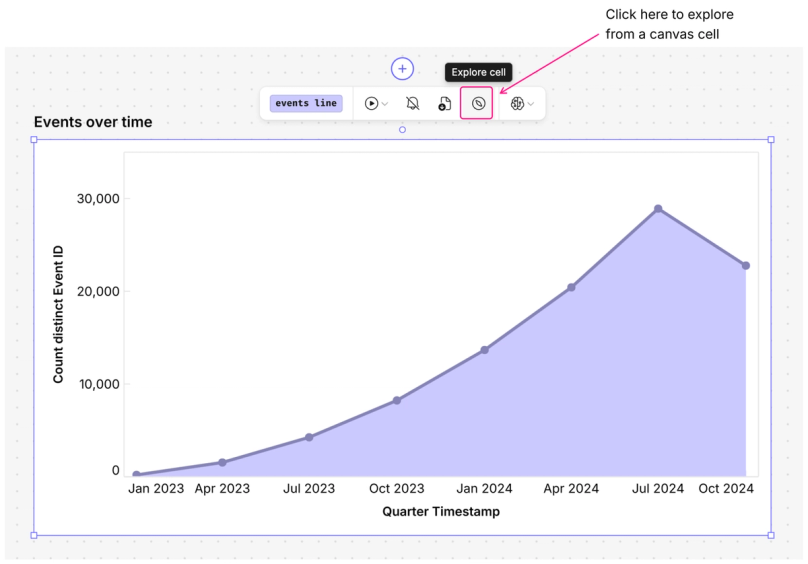
1. Click & explore - select a visualization in a canvas and click the Explore cell icon to begin.
1. Analyze & customize - the visualization will open in a new tab, where you can add additional data layers and explore the data further.
2. Decide next steps - once you’ve completed your exploration, you have two options:
3. Save & share - if you choose to save the visual, select a project to save it to. This opens the new canvas, where you can continue your analysis, add notes or labels, and share it with stakeholders for feedback.
The Explore cell feature enhances data exploration, allowing for easy navigation between visualizations and enabling efficient collaboration and decision-making.