Count 101 for viewers & explorers
Use this tutorial to start exploring in Count.
Tutorial summary
Discover how to navigate Count, from viewing dashboards to exploring data. This tutorial guides viewers and explorers through features, interactions, and collaborative workflows step by step.
What you will learn
- Navigate your workspace with ease
- Features available based off your user role (Viewers / Explorers)
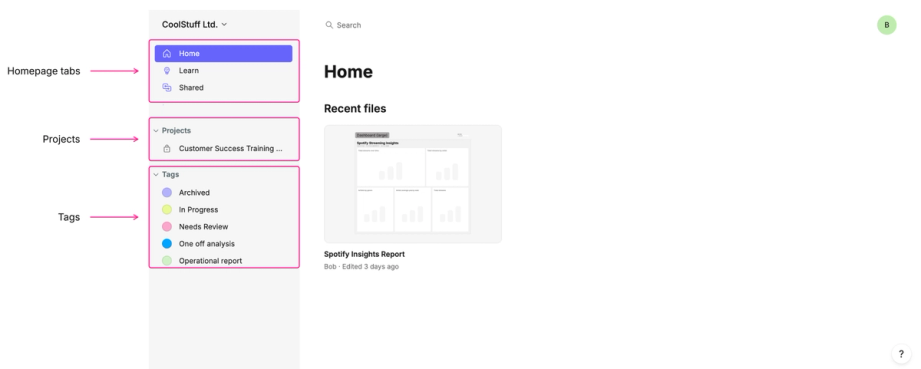
Getting Started: Home Screen Overview
- Home Tab: Shows all recently accessed files.
- Learn Tab: Access tutorials, best practice guides, and documentation.
- Share Tab: Displays canvases shared directly with you.
- Projects: Shows accessible projects.
- Tags: Organize canvases by tags like In Progress or One-Off Analysis.
Presentation-Only Access (Viewers)
Key Capabilities
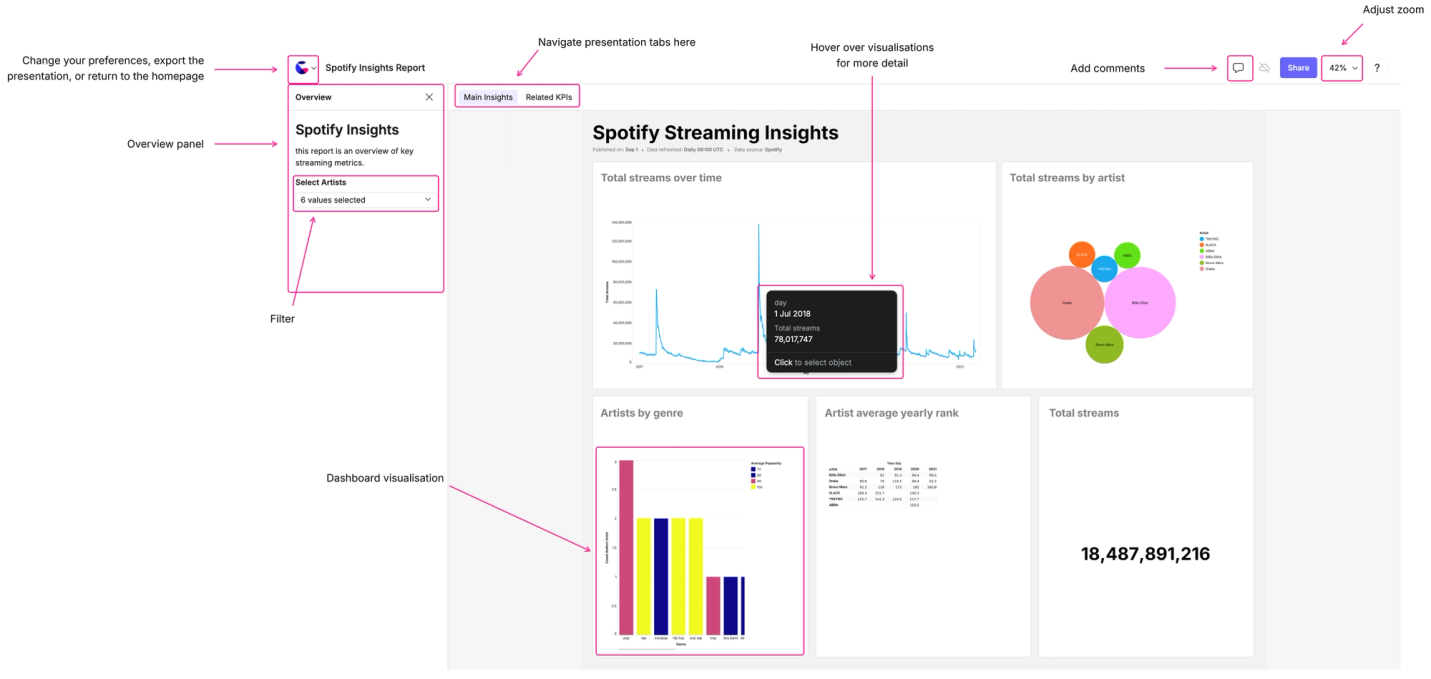
- Enter presentation view directly when opening a canvas.
- Interact with filters and dashboard visualizations.
- Hover tooltips: Pin values for copying.
- Overview panel: Contains headings, notes, and control cells for quick filter access.
- Multi-tab support: Navigate multiple tabs within a presentation.
- Add comments and @mention other users for feedback.
- Zoom & pan: Use toolbar or keyboard/mouse shortcuts.
- Export & notifications: PDF/image export, toggle comments, subscribe to updates.
Canvas Access (Members with Edit Access)
Canvas Interaction
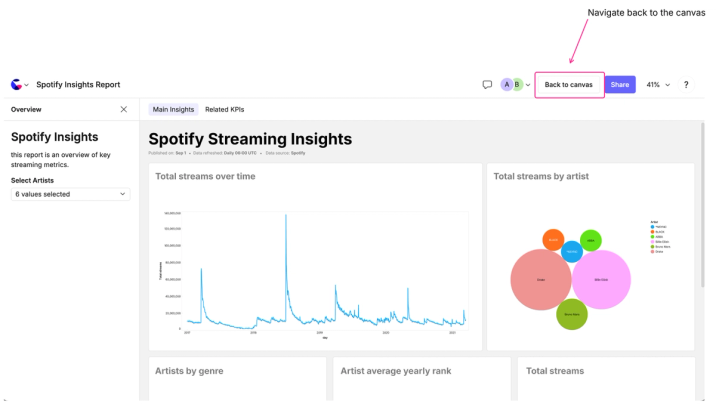
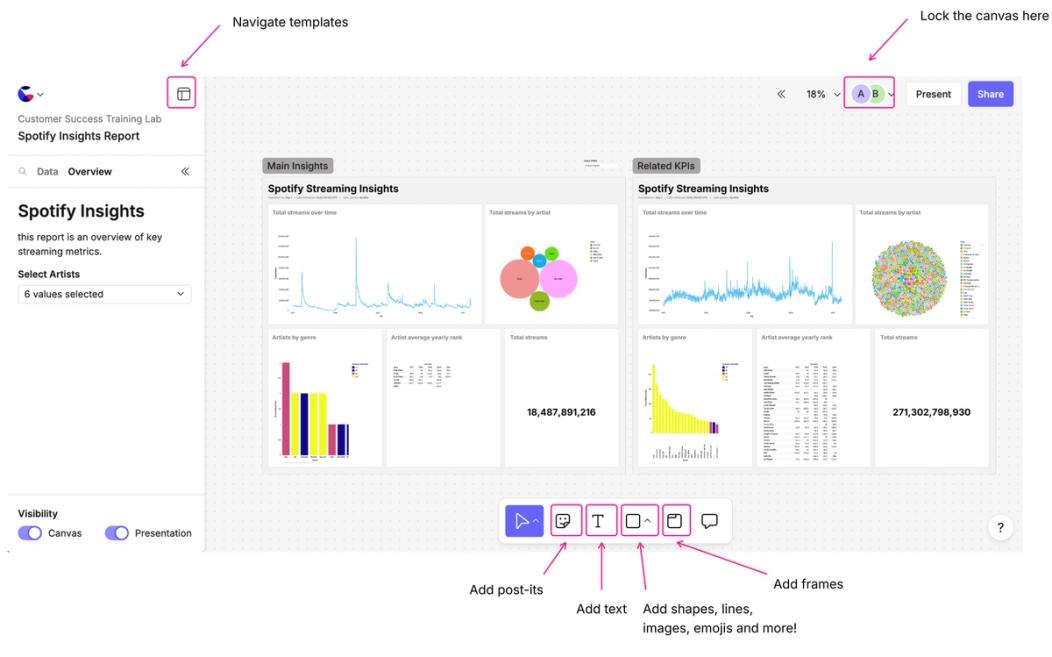
- Switch between presentation view and full canvas using Back to Canvas.
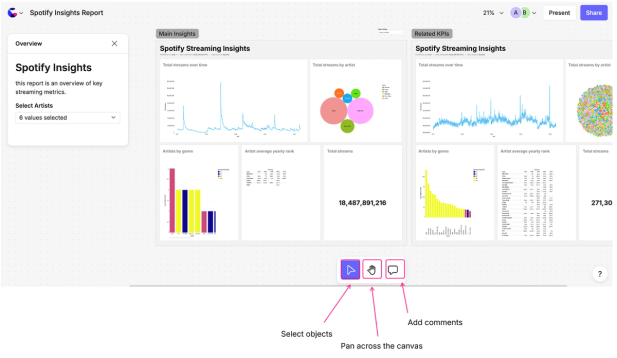
- Pan, zoom, and use the hand tool for navigation.
- Comment using the comment button in the tool tray.
Editing & Whiteboarding Tools
- Create new canvases or use templates.
- Overview panel editing: Add notes, headings, control cells.
- Whiteboarding: Post-its, shapes, lines, connectors, freehand drawing, emoji stamps, images, and embedded links.
- Frames: Organize whiteboarding areas, lock or hide content to prevent accidental edits.
- Lock Canvas: Create isolated sessions to avoid impacting others’ filters.
Exploring Data (Explorers)
Explore Sessions
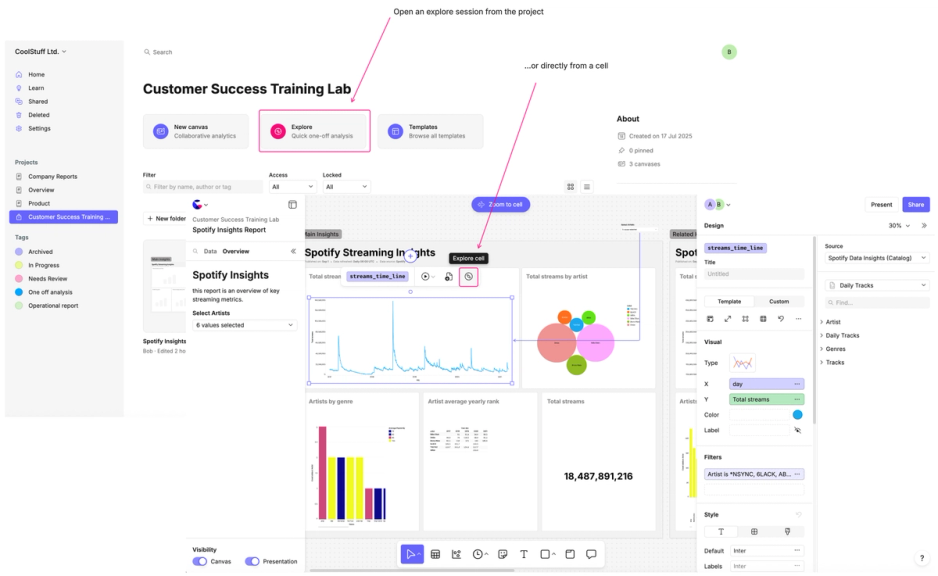
- Open from project level or individual cells.
- Drag-and-drop fields into axes for visualization.
- Customize charts:
- Discrete/continuous color scales
- Secondary axes
- Legends & tooltips
- Custom templates or multi-layered marks
- Save explore sessions as new canvases or discard temporary work.
Low-Code Tables & Visualizations
Count’s low-code cells make it easy for anyone to explore and analyze data—no SQL needed.
Join tables, apply filters, and build compelling visualizations through a simple, intuitive interface. And if you want to take things a step further, you can unlock even more flexibility with simple SQL calculations - right inside your visuals.
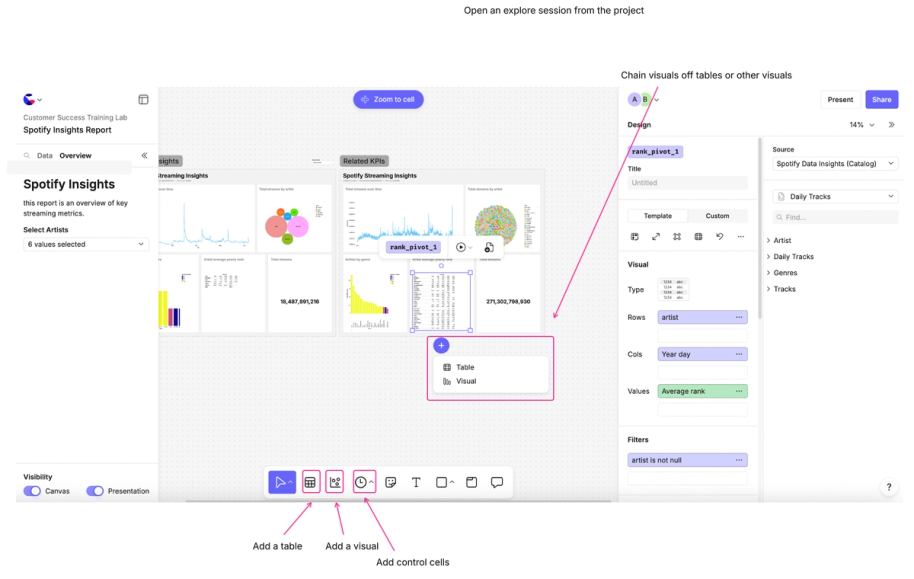
- Create tables or charts directly from catalog fields.
- Chain visuals from prepared tables for advanced analysis.
- Learn more about how to do joins and calculations in visuals and low-code cells.
Templates
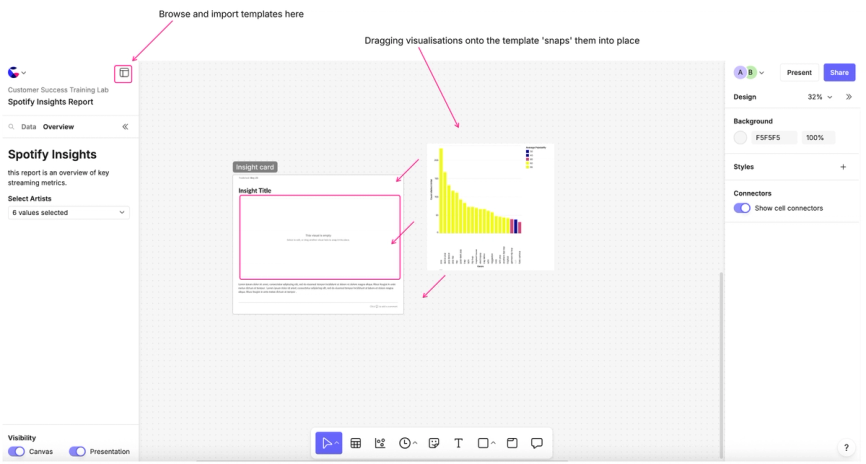
- Access built-in templates for rapid report creation.
- Preview before use, then customize visual frames with your visuals.
Control Cells & Filters
Adding Controls
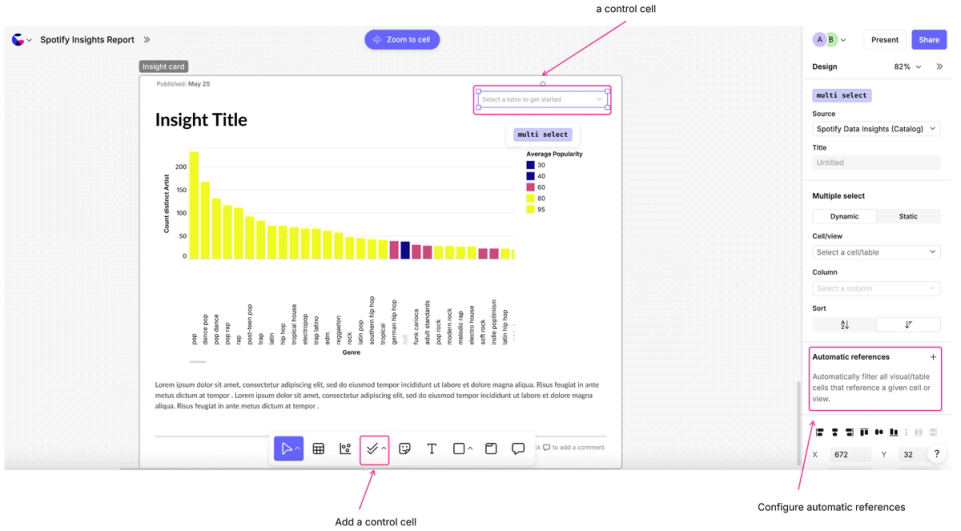
- Include date pickers, multi-select, sliders, toggles.
- Connect manually or use automatic references for multiple visuals.
- Apply controls to specific frames or globally across canvas.
Best Practices
- Name control cells clearly for end-user context.
- Include in overview panel for easier navigation in presentation mode.
- Verify behavior in presentation mode: only objects within frames are visible.